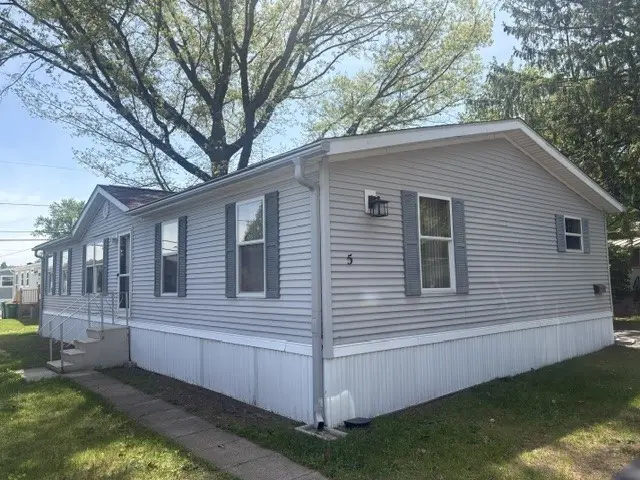
5 Skyview Dr
St. John Fisher College, NY 14626
$54,900B
3 bd · 2.0 ba ·
1,387 sqft ·
Built 2000
· Manufactured
· Pending
· 16 DOM
Cashflow @ list (25.0% down · 7.5%)
Estimated rent
$1,968/mo
Mortgage (P&I)
−$288
Tax + insurance
−$92
HOA
−$0
Vac / Maint / Mgmt
−$413
Net cashflow
$1,175/mo
Annual
$14,104/yr
Cap rate
31.98%
Cash-on-cash
91.75%
DSCR
5.08
1% rule
3.58%
Cash to close
$15,372
Investor read
- This is a 3-bed/2.0-bath manufactured listed at $55k. Condition is rated average.
- At list price, monthly cash flow is $1k ($14k/yr) — positive.
- The deal already cash-flows at list — no discount required.
- Meets the 1% rule at list price ($2k rent vs $55k).
- It's been on market 16 days — a 2% lower offer ($54k) is reasonable based on typical stale-listing flexibility.
- Recommended offer: $54k (1.5% below list) — sets the bar for market timing.
- Local home prices are declining (-3.0%/yr); year-one equity from $380 of loan paydown is wiped out by about $2k of value loss. Plan a longer hold.
- Location reads: area grade B — affects rentability + tenant quality, not the cash-flow math above.
- Penfield Central School District (suburban): math 77% / reading 79% proficiency, ranked #67 of 590 in NY (top 11%) — strong family-tenant draw, lease renewals of 3-5y typical; only 11% free/reduced lunch — higher-income household profile.
- Zoned schools: Indian Landing Elementary School (math 72% / reading 72%, grade A-, #378 of 2,108 statewide, top 20%, 542 students, 22% FRL); Bay Trail Middle School (math 59% / reading 78%, grade A, #94 of 729 statewide, top 13%, 1,113 students, 23% FRL); Penfield Senior High School (math 98% / reading 72%, grade A, #369 of 1,100 statewide, top 34%, 1,424 students, 25% FRL).
- Market conditions: Rents rising (+2.5%/yr); 129 active listings in the ZIP; 7 comparable units currently listed for rent nearby; rentals leasing fast (median 4d on market — plan ~1-2 weeks tenant-placement turnaround); solid renter incomes; 1,169 units permitted in Monroe County in 2024 (591 in 5+ unit buildings).
- Monroe County population projected to shrink 6% by 2050 — rents likely to lag national; underwrite the cash flow, not the appreciation.
- At projected returns (-3.0% appreciation + 2.5% rent growth), your $15k cash investment doubles in ~2 years — after that, you're playing with house money.
- Cap rate 32.0% vs local median 16.6% in St. John Fisher College — top-decile yield for the area; either an underpriced asset or a hidden risk that comps aren't pricing in. Stress-test before assuming the spread holds.
- This rent runs 30% of the median local income ($78k/yr) — at the standard rent-burdened threshold; future hikes will face affordability resistance.
Questions for listing agent
- Is there a deadline driving the sale (1031 exchange, divorce, estate, relocation)? That informs how much negotiation room exists.
- What's the average days-on-market for RENTAL listings here right now (not sales)? A rising rental-DOM trend means longer vacancies and softer asking-rent achievability than the comps imply.
- What's the recent tenant-quality profile in this submarket — average credit score on applications, eviction rate, late-payment / NSF rate, and stable-employment percentage? A property-management company in the area should have these aggregated.
- How much new for-sale + rental construction is in the pipeline within 1–3 miles? Heavy new supply typically softens prices + rents 12–24 months out; constrained supply supports both.
Repairs flagged (vision-AI assessment)
- Minor: Paint — Light wear
- Minor: Flooring — Light wear
- Minor: Kitchen cabinets — Light wear
- Minor: Bathroom fixtures — Light wear
CashFlowRE · CFR-MXNFA0A89QG9G4
· Data 1 week ago
cashflowre.app · 2026-05-29