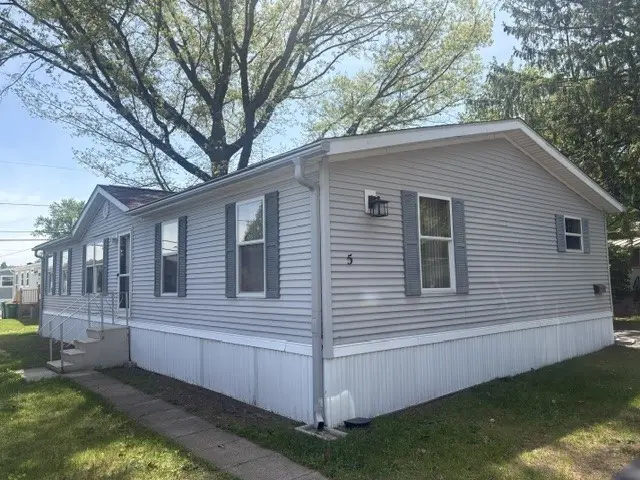
5 Skyview Dr · St. John Fisher College, NY
Flood risk 1/10 · Minimal
- FEMA flood zone
- X (unshaded)
- Chance of flooding over 30 yrs
- 0.0%
- Est. flood insurance / yr
- $507 – $1,088
Fire risk 1/10 · Minimal
- Est. fire insurance / yr
- $691 – $1,283
Heat risk 2/10 · Minimal
- Hot days now (above 95°F)
- 7 days/yr
- Hot days in 30 yrs
- 15 days/yr
Wind risk 1/10 · Minimal
- Chance of severe wind over 30 yrs
- —
Air-quality risk 2/10 · Minimal
- Unhealthy air days now
- 1 days/yr
- Unhealthy air days in 30 yrs
- 2 days/yr
Risk factors via First Street. Map © Google.
Why this score? — see what drove the B grade
The composite is a weighted blend of 9 inputs, each scored 0–100. Each bar is that input's sub-score; the figure is the points it added to the 100-point composite (weight × sub-score).
- Cash flow +30.0/30.0
- 1% rule +10.0/10.0
- DSCR +10.0/10.0
- ARV discount +7.5/15.0
- Schools +6.8/10.0
- Rent growth +3.1/5.0
- Condition / age +2.8/5.0
- Livability +2.5/5.0
- Appreciation +0.0/10.0
$54,900
🖨 Deal sheet (PDF) 📄 Offer letter ✓ Due diligence
Listing remarks
Affordable living in Penfield with Penfield Schools! This spacious 3-bedroom, 2 full bathroom home offers comfortable living space in a convenient location close to shopping, restaurants, and expressway access. Inside, you’ll find a functional layout with generously sized living spaces and room to spread out. Major updates provide peace of mind, including a new roof, newer furnace, tankless hot water system, and central air for year-round comfort. Plus, a generator hookup adds extra convenience and preparedness. Whether you’re looking for an affordable primary residence, downsizing, or just want low-maintenance living in a great location, this home offers incredible value. Don&r
Key facts
- Newer furnace
- Penfield schools
- Generator hookup
Tags
Property features AI
Finance
- HOA & community: Land lease: $805
Exterior
- Parking: No garage
- Utilities: Electricity connected; Public water connected; Sewer connected; High-speed internet available; Cable available
- Home design: Double-wide mobile home; Single-story (1 story); Resale property
- Construction: Vinyl siding
- Exterior features: Propane tank (leased); Shed(s) and additional storage; Irregular-shaped lot; See remarks for additional exterior details
Interior
- Kitchen: Electric oven and electric range; Dishwasher; Microwave; Refrigerator; Range hood; Garbage disposal
- Bedrooms: Three main-level bedrooms
- Flooring: Carpet; Vinyl; Varied flooring throughout
- Bathrooms: Two full bathrooms (both on the main level)
- Heating & cooling: Forced-air heating (propane); Central air conditioning
- Interior features: Breakfast bar; Ceiling fans; Solid surface counters; Primary bedroom with private bath
- Laundry & utility: Main-level laundry with washer and dryer; Tankless water heater; Generator
Neighborhood map
What this means for you Summary
Snapshot
- This is a 3-bed/2.0-bath manufactured listed at $55k. Condition is rated average.
Deal economics
- At list price, monthly cash flow is $1k ($14k/yr) — positive.
- The deal already cash-flows at list — no discount required.
- Meets the 1% rule at list price ($2k rent vs $55k).
- Recommended offer: $54k (1.5% below list) — sets the bar for market timing.
- Cap rate 32.0% vs local median 16.6% in St. John Fisher College — top-decile yield for the area; either an underpriced asset or a hidden risk that comps aren't pricing in. Stress-test before assuming the spread holds.
Location & tenants
- Location reads: area grade B — affects rentability + tenant quality, not the cash-flow math above.
- Penfield Central School District (suburban): math 77% / reading 79% proficiency, ranked #67 of 590 in NY (top 11%) — strong family-tenant draw, lease renewals of 3-5y typical; only 11% free/reduced lunch — higher-income household profile.
- Zoned schools: Indian Landing Elementary School (math 72% / reading 72%, grade A-, #378 of 2,108 statewide, top 20%, 542 students, 22% FRL); Bay Trail Middle School (math 59% / reading 78%, grade A, #94 of 729 statewide, top 13%, 1,113 students, 23% FRL); Penfield Senior High School (math 98% / reading 72%, grade A, #369 of 1,100 statewide, top 34%, 1,424 students, 25% FRL).
- Market conditions: Rents rising (+2.5%/yr); 126 active listings in the ZIP; 7 comparable units currently listed for rent nearby; rentals leasing fast (median 4d on market — plan ~1-2 weeks tenant-placement turnaround); solid renter incomes; 1,169 units permitted in Monroe County in 2024 (591 in 5+ unit buildings).
- This rent runs 30% of the median local income ($78k/yr) — at the standard rent-burdened threshold; future hikes will face affordability resistance.
Forward outlook
- Local home prices are declining (-3.0%/yr); year-one equity from $380 of loan paydown is wiped out by about $2k of value loss. Plan a longer hold.
- Monroe County population projected to shrink 6% by 2050 — rents likely to lag national; underwrite the cash flow, not the appreciation.
- At projected returns (-3.0% appreciation + 2.5% rent growth), your $15k cash investment doubles in ~2 years — after that, you're playing with house money.
Negotiation context
- It's been on market 16 days — a 2% lower offer ($54k) is reasonable based on typical stale-listing flexibility.
Questions for the listing agent
- Is there a deadline driving the sale (1031 exchange, divorce, estate, relocation)? That informs how much negotiation room exists.
- What's the average days-on-market for RENTAL listings here right now (not sales)? A rising rental-DOM trend means longer vacancies and softer asking-rent achievability than the comps imply.
- What's the recent tenant-quality profile in this submarket — average credit score on applications, eviction rate, late-payment / NSF rate, and stable-employment percentage? A property-management company in the area should have these aggregated.
- How much new for-sale + rental construction is in the pipeline within 1–3 miles? Heavy new supply typically softens prices + rents 12–24 months out; constrained supply supports both.
Investment metrics
- 1% rule
- 3.58% ✓
- Cap rate
- 31.98%
- Cash-on-cash
- 91.75%
- DSCR
- 5.08
- GRM
- 2.3
CMA / ARV
- ARV (on-the-fly)
- $130,378
- Comps found
- 8
Show comp detail 8 sales within ~0.75 mi
| Address | Dist | Beds/Ba | Sqft | Sold | Price | $/sf | Match |
|---|---|---|---|---|---|---|---|
| 2 Penview Dr | 0.03mi | 4/2.0 (+1) | 1,404 (+1%) | 9mo | $155,000 | $110 | 84 |
| 34 Ewald Dr | 0.17mi | 3/2.0 | 1,387 (0%) | 11mo | $130,000 | $94 | 83 |
| 1 Beatrice Dr | 0.17mi | 3/2.0 | 1,387 (0%) | 13mo | $132,000 | $95 | 81 |
| 36 Sebastian Dr | 0.27mi | 3/2.0 | 1,387 (0%) | 10mo | $130,000 | $94 | 79 |
| 7 Skyway Dr | 0.11mi | 4/2.0 (+1) | 1,456 (+5%) | 8mo | $134,000 | $92 | 75 |
| 23 Ewald Dr | 0.17mi | 3/2.0 | 1,387 (0%) | 20mo | $136,000 | $98 | 75 |
| 26 Fondiller Ave | 0.22mi | 3/2.0 | 1,200 (-14%) | 5mo | $71,000 | $59 | 63 |
| 27 Elderberry Cir | 0.27mi | 3/2.0 | 1,300 (-6%) | 24mo | $90,000 | $69 | 57 |
Match score weights: distance 35% · size 25% · config 20% · recency 20%. Top-matched comps best support the ARV.
Projected returns pro-forma
-3.0% appreciation · 2.5% rent growth · sell at horizon
- IRR
- 91.9%
- Equity multiple
- 5.23×
- Total profit
- $65,003
- Equity at exit
- $8,186
- IRR
- 94.7%
- Equity multiple
- 10.70×
- Total profit
- $149,110
- Equity at exit
- $4,747
Cash invested: $15,372 (down + closing). Projections, not guarantees.
Landlord ↔ Tenant lean methodology
- Overall (STATE)
- 15 Strongly Tenant-Friendly
- State New York
- 15 Strongly Tenant-Friendly · D+10
- County
- — inherits STATE
- City
- — inherits STATE
ZIP-level market 14626
- Home prices YoY
- -31.4%
- Rents YoY
- 2.5%
- Active inventory
- 126
- Price-to-rent
- 2.3×
Monthly cashflow live
- Estimated rent
- $1,968 high interval (Pro) →
- Mortgage (P&I)
- −$288
- Tax est. 1.5%
- −$69 /mo · $824/yr
- Insurance
- −$23
- HOA
- −$0
- Vacancy / Maint / Mgmt
- −$413
- Net cashflow
- $1,175
Break-even live
Sensitivity live
| Price | -10% $1,213 | -5% $1,194 | +0% $1,175 | +5% $1,156 | +10% $1,137 |
|---|---|---|---|---|---|
| Rent | -10% $1,020 | -5% $1,098 | +0% $1,175 | +5% $1,253 | +10% $1,331 |
| Rate | -1.0pp $1,203 | -0.5pp $1,189 | base $1,175 | +0.5pp $1,161 | +1.0pp $1,147 |
UW: 25.0% down · 7.5% · 30yr · 1.5% tax · 5.0% vac · 8.0% maint · 8.0% mgmt
Financing live
Cash to close
- Down payment
- $13,725
- Closing costs
- $1,647
- Reserves months
- —
- Total cash needed
- —
Loan-product check · same deal, 3 products live
Conventional
25% down · 7.5% · 30yr
- Down + closing
- —
- Monthly P&I
- —
- Monthly cashflow
- —
- DSCR
- —
- Eligible?
- —
Personal DTI + credit; lowest rate.
DSCR
20% down · 8.5% · 30yr
- Down + closing
- —
- Monthly P&I
- —
- Monthly cashflow
- —
- DSCR
- —
- Eligible?
- —
No personal income docs; deal must DSCR.
Hard money
10% down · 12.0% · 12mo
- Down + closing
- —
- Monthly P&I
- —
- Monthly cashflow
- —
- DSCR
- —
- Eligible?
- —
Short-term bridge; refi at stabilization.
Rent comps 7 comps
| Address | Beds | Baths | Sqft | Rent | $/sqft | DOM | Units | Dist |
|---|---|---|---|---|---|---|---|---|
| 3540 East Ave Rochester, NY | 1.0–2.0 | 1.0–2.5 | 1261 | $4,123 | $3.27 | 4d | 10 | 0.58mi |
| 3765 East Ave Rochester, NY | 2.0 | 1.5 | 1826 | $2,900 | $1.59 | 4d | 1 | 0.81mi |
| 278 Penn Ln Rochester, NY | 2.0 | 2.0 | 1184 | $2,100 | $1.77 | 4d | 1 | 1.01mi |
| 18 Brook Hill Ln Rochester, NY | 1.0–2.0 | 1.0–1.5 | 841 | $1,915 | $2.28 | 4d | 1 | 1.05mi |
| 214 Magnolia Ave East Rochester, NY | 3.0 | 1.0 | 1200 | $1,600 | $1.33 | 25d | 1 | 1.32mi |
| 218 1/2 Magnolia Ave East Rochester, NY | 3.0 | 1.5 | 1200 | $1,400 | $1.17 | 45d | 1 | 1.34mi |
| 108 W Filbert St Unit 2 East Rochester, NY | 2.0 | 1.0 | 1100 | $1,525 | $1.39 | 4d | 1 | 1.49mi |
Listing history 10 events
-
2026-06-13statusdays on market $54,900 Pending 16 DOM
-
2026-06-10days on market $54,900 Active Under Contract 14 DOM
-
2026-06-09days on market $54,900 Active Under Contract 13 DOM
-
2026-06-09days on market $54,900 Active Under Contract 12 DOM
-
2026-06-07statusdays on market $54,900 Active Under Contract 11 DOM
-
2026-06-03days on market $54,900 Active 7 DOM
-
2026-06-03days on market $54,900 Active 6 DOM
-
2026-06-01days on market $54,900 Active 5 DOM
-
2026-05-31days on market $54,900 Active 4 DOM
-
2026-05-27$54,900 Active
ⓘ Source: listings_history table (triggers on properties + properties_extension) + one-shot
backfill from property_details.listing_events for pre-trigger history.
Climate risk First Street
- Flood 1/10 Low FEMA zone X (unshaded) · 0% chance over 30 yrs
- Wildfire 1/10 Low
- Heat 2/10 Low 7 d/yr ≥95°F today · 15 d/yr by 30 yrs out
- Wind 1/10 Low
- Air quality 2/10 Low 1 unhealthy d/yr today · 2 by 30 yrs out
Nearby sold comps map
Loading sold comps map…
Walkable amenities ~0.75 mi
Loading nearby amenities…
Taxation est. · year 1
- Rental income
- $23,616
- − Mortgage interest
- −$3,075
- − Property taxes
- −$824
- − Insurance
- −$274
- − Repairs & maintenance
- −$1,889
- − Management
- −$1,889
- − Depreciation
- −$1,597
- Taxable income
- $14,067
- Est. tax owed @ 24.0%
- −$3,376
- After-tax cash flow
- $10,728/yr
For passive investors: Depreciation is non-cash, so a rental often shows a tax loss while cash-flowing — sheltering income. Rental losses are passive: they offset passive income freely, and up to $25,000/yr can offset ordinary (W-2) income if you actively participate and your MAGI is under $100k (phasing out to $0 by $150k); unused losses carry forward. On sale, claimed depreciation is recaptured at up to 25%, and gains may owe capital-gains tax (a 1031 exchange can defer both). Figures are a year-1 estimate at your 24.0% rate — not tax advice; consult a CPA.
Condition & rehab AI · 12 photos
This 3-bedroom, 2-bathroom home in Penfield, NY, requires moderate repairs and maintenance to improve its condition and value. Fresh paint and minor updates to the kitchen and bathrooms can significantly enhance its appeal.
Repairs flagged
- Minor Paint — Light wear
- Minor Flooring — Light wear
- Minor Kitchen cabinets — Light wear
- Minor Bathroom fixtures — Light wear
Value-add opportunities
- Resale Paint — Fresh paint can make a home look more appealing
- Resale Flooring — New flooring can improve the home's appearance and functionality
- Resale Kitchen cabinets — Fresh paint and minor updates can make the kitchen more inviting
- Resale Bathroom fixtures — Fresh paint and minor updates can make the bathroom more inviting
Renovation cost estimate screening
| Repair item | Severity | Est. cost |
|---|---|---|
| Paint · Light wear | Minor | $500–3,000 |
| Flooring · Light wear | Minor | $500–3,000 |
| Kitchen cabinets · Light wear | Minor | $500–3,000 |
| Bathroom fixtures · Light wear | Minor | $500–3,000 |
| Total estimated repair cost · 4 items | $2,000–12,000 |
Value-add ROI direction
- Resale Paint — Fresh paint can make a home look more appealing ↑
- Resale Flooring — New flooring can improve the home's appearance and functionality ↑
- Resale Kitchen cabinets — Fresh paint and minor updates can make the kitchen more inviting ↑
- Resale Bathroom fixtures — Fresh paint and minor updates can make the bathroom more inviting ↑
ⓘ Cost ranges are severity-bucket heuristics (US national rule-of-thumb). Get contractor quotes + a written scope before underwriting a rehab budget.
Schools (NCES district)
- District
- Penfield Central School District
- NCES district ID
- 3622710
- Math proficiency
- 77% ▼ -3.00%
- Reading proficiency
- 79% ▲ 10.00%
- Median HH income
- $74,802
- Composite
- 68.37/100
- National rank
- #347
- State rank
- #67 of 590 in NY
Livability — St. John Fisher College
No livability data for this city. (Only ~50 U.S. cities are tracked.)
Census & demographics
- County
- Monroe County · 674,131 people
- Metro
- Rochester, NY
- Population (ZIP)
- 29,273
- Household income
- $78,204
- Rent vs Own
- Severe rent burden
- 810.0
Population outlook (Monroe County) Hauer SSP2
- Today (2025)
- 759,460 people
- By 2030
- 757,154 · -0.3%
- By 2040
- 740,644 · -2.5%
- By 2050
- 714,443 · -5.9%
- By 2075
- 645,883 · -15.0%
- By 2100
- 547,084 · -28.0%
Race, ethnicity, and origin ACS 2023
- Neighborhood character
- Predominantly White (77%)
- Race & ethnicity
- White 77% Black 9% Hispanic / Latino 8% Two or more races 6% Asian 3%
- Hispanic origin (detail)
- Mexican 1% Puerto Rican 5%
- Common ancestry
- Romanian 5% Lithuanian 2% Subsaharan African 2%
- Foreign-born
- 9% · Canada, Vietnam, South Korea
- Languages at home
- 89% English-only · Other Indo-European 3% Spanish 3% Russian/Polish/Slavic 1%
Political lean MEDSL · Monroe
- 2024 margin
- D (+19.1) · D 59.5% · R 40.5%
- 2008→2024 swing
- +1.4pp toward D · 2008: 17.7pp · 2024: 19.1pp
- All cycles
- 2024: D+19.1 2020: D+21.0 2016: D+14.1 2012: D+17.4 2008: D+17.7
Not yet ingested
- Civics
- —
Market trends
- HPI YoY
- ▼ -113.91%
- Current HPI
- 248.9836
- Rent YoY
- ▲ 2.50%
- Metro
- Rochester, NY
- State GDP YoY
- ▲ 2.60%
- F500 in state
- 92
Industry mix (Fortune 500 HQ in NY)
| Industry | F500 HQs | Revenue |
|---|---|---|
| Financial Services | 10 | $950B |
|
||
| Consumer Goods | 9 | $162B |
|
||
| Insurance | 4 | $225B |
|
||
| Telecommunications | 2 | $144B |
|
||
| Pharmaceuticals | 2 | $112B |
|
||
| Media / Entertainment | 2 | $69B |
|
||
Price history
1 event — show timeline
- 2026-05-27 Listed $54,900 UNYREIS
Cash-flow waterfall
monthlySold comps — $/sqft
last 12 mo · ≤1 miLoading sold comps…