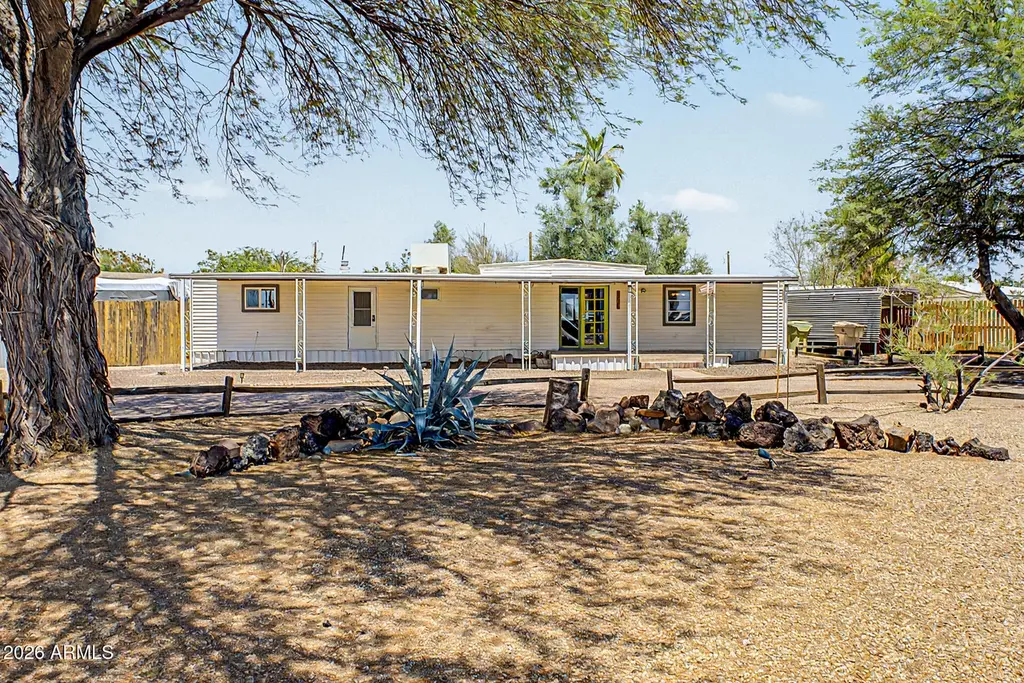
15801 N 67th Ave
Glendale, AZ 85306
$165,000C-
2 bd · 1.0 ba ·
720 sqft ·
Built 1970
· Manufactured
· Pending
· 6 DOM
Cashflow @ list (25.0% down · 7.5%)
Estimated rent
$1,501/mo
Mortgage (P&I)
−$865
Tax + insurance
−$275
HOA
−$0
Vac / Maint / Mgmt
−$315
Net cashflow
$45/mo
Annual
$544/yr
Cap rate
6.62%
Cash-on-cash
1.18%
DSCR
1.05
1% rule
0.91%
Cash to close
$46,200
Investor read
- This is a 2-bed/1.0-bath manufactured listed at $165k.
- At list price, monthly cash flow is $45 ($544/yr) — positive.
- The deal already cash-flows at list — no discount required.
- To meet the 1% rule (rent ≥ 1% of price), the offer needs to be $150k (9.0% below list).
- Only 6 days on market — expect competitive offers; lowballing is unlikely to land.
- Recommended offer: $150k (9.0% below list) — sets the bar for 1% rule.
- Local home prices are declining (-3.0%/yr); year-one equity from $1k of loan paydown is wiped out by about $5k of value loss. Plan a longer hold.
- Location reads 76/100 on livability (#12 in AZ, #3,235 nationally) — a middle-class / working-renter tenant base. Strengths: commute A+, housing A+, amenities B; Watch: health & safety D+, crime F.
- Peoria Unified School District (4237) (suburban): math 36% / reading 42% proficiency, ranked #64 of 249 in AZ (top 26%) — families likely to look elsewhere, expect single-tenant / working-renter base with shorter leases.
- Zoned schools: Foothills Elementary School (math 30% / reading 34%, grade F, #505 of 1,109 statewide, top 47%, 604 students, 58% FRL); Cactus High School (math 27% / reading 31%, grade F, #130 of 381 statewide, top 34%, 1,144 students, 44% FRL) — zoned schools average 51% FRL vs 35% district-wide (16 pts higher); higher-poverty schools than district average — tighter screening recommended.
- Market conditions: Rents rising (+1.9%/yr); 92 active listings in the ZIP; 6 comparable units currently listed for rent nearby; rentals leasing fast (median 4d on market — plan ~1-2 weeks tenant-placement turnaround); solid renter incomes; 36,011 units permitted in Maricopa County in 2024 (12,801 in 5+ unit buildings).
- Maricopa County population projected at +38% by 2050 — long-run rental-demand tailwind backs the buy-and-hold thesis.
- Climate carrying-cost: extreme-heat days projected 7→19/yr by 2055 (HVAC capex compounding) — expect insurance premiums to compound above CPI over the hold.
- Cap rate 6.6% vs local median 3.5% in Glendale — top-decile yield for the area; either an underpriced asset or a hidden risk that comps aren't pricing in. Stress-test before assuming the spread holds.
Questions for listing agent
- Built in 1970 — when were the roof, HVAC, electrical panel, plumbing, and water heater last replaced?
- Is there a deadline driving the sale (1031 exchange, divorce, estate, relocation)? That informs how much negotiation room exists.
- Crime grade is F in this area — have there been break-ins, vandalism, or insurance claims at this property in the last 3 years? What carrier currently insures it and at what premium?
- What's the average days-on-market for RENTAL listings here right now (not sales)? A rising rental-DOM trend means longer vacancies and softer asking-rent achievability than the comps imply.
- What's the recent tenant-quality profile in this submarket — average credit score on applications, eviction rate, late-payment / NSF rate, and stable-employment percentage? A property-management company in the area should have these aggregated.
- How much new for-sale + rental construction is in the pipeline within 1–3 miles? Heavy new supply typically softens prices + rents 12–24 months out; constrained supply supports both.
CashFlowRE · CFR-MXVXS29DFQ2RXR
· Data 3 weeks ago
cashflowre.app · 2026-05-29