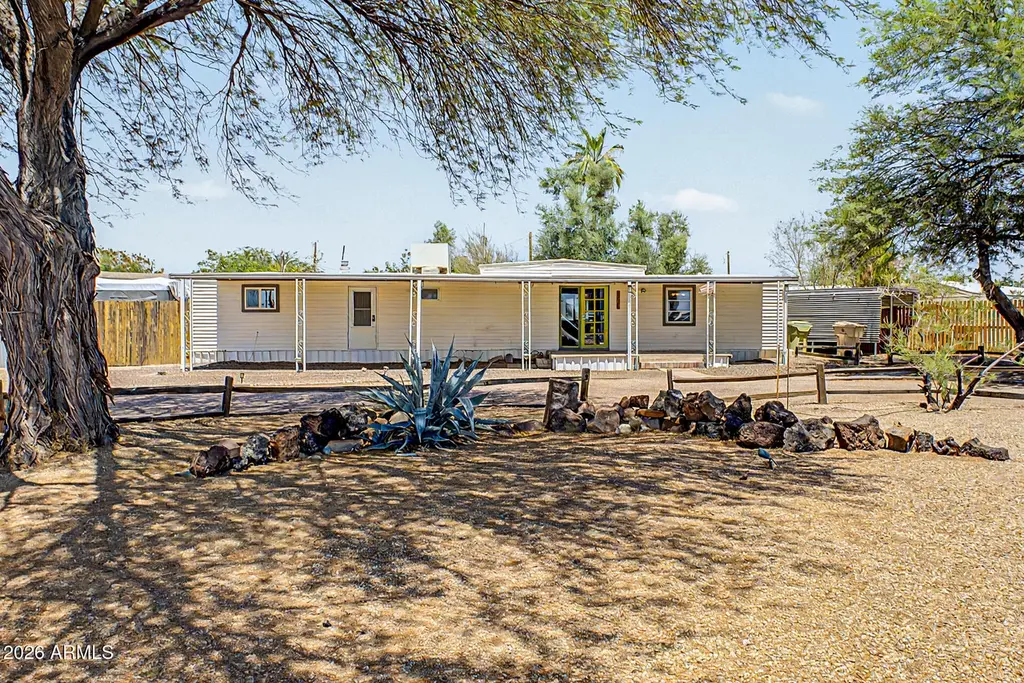
15801 N 67th Ave · Glendale, AZ
Flood risk 1/10 · Minimal
- FEMA flood zone
- X (shaded)
- Chance of flooding over 30 yrs
- 0.0%
- Est. flood insurance / yr
- $507 – $1,088
Fire risk 1/10 · Minimal
- Est. fire insurance / yr
- $610 – $1,132
Heat risk 9/10 · Severe
- Hot days now (above 112°F)
- 7 days/yr
- Hot days in 30 yrs
- 19 days/yr
Wind risk 1/10 · Minimal
- Chance of severe wind over 30 yrs
- —
Air-quality risk 3/10 · Minor
- Unhealthy air days now
- 3 days/yr
- Unhealthy air days in 30 yrs
- 3 days/yr
Risk factors via First Street. Map © Google.
Why this score? — see what drove the C- grade
The composite is a weighted blend of 9 inputs, each scored 0–100. Each bar is that input's sub-score; the figure is the points it added to the 100-point composite (weight × sub-score).
- ARV discount +15.0/15.0
- Cash flow +14.8/30.0
- DSCR +4.5/10.0
- 1% rule +4.1/10.0
- Livability +3.8/5.0
- Schools +3.5/10.0
- Rent growth +3.0/5.0
- Condition / age +2.5/5.0
- Appreciation +0.0/10.0
$165,000
🖨 Deal sheet (PDF) 📄 Offer letter ✓ Due diligence
Listing remarks
Incredible opportunity to secure 1/3 acre property on a corner lot with N/S exposure in the heart of Glendale at 67th Ave. just north of Greenway with NO HOA! Property features include nearly 14,500 sq ft lot on owned land with a 2 car carport, RV gate with lots of room for extra parking, & a 700 sq ft mobile home that offers 2 beds & 1 bath. Inside includes vinyl wood-look flooring in family room that leads into kitchen that offers butchers block counters, white cabinetry, & tile backsplash. Refrigerator, washer, and dryer all included! Out back, you'll have a covered patio perfect for relaxation, a workshop waiting for your projects, a pergola perfect for gatherings, with
Key facts
- Extra parking
- Rv gate
- Owned land
Tags
Property features AI
Finance
- Financial info: Non-assumable financing
- HOA & community: No association fees
Exterior
- Parking: 2 covered parking spaces; RV access and RV gate; 2 carport spaces
- Utilities: City water; Public sewer and septic connected
- Home design: Manufactured/mobile home; Fee simple ownership
- Construction: Vinyl siding and painted exterior; Metal roof; Building area reported by owner
- Exterior features: Storage; Shed(s); Gazebo; Chain-link and wood fencing; Sprinklers front and rear with automatic timer; Desert front and back landscaping; Gravel/stone front and back; City-maintained road
Interior
- Kitchen: Non-laminate counters; Refrigerator
- Bedrooms: Space for 2 possible bedrooms
- Flooring: Carpet; Vinyl
- Bathrooms: 1 full bathroom
- Heating & cooling: Electric heating; Central air; Ceiling fans; Evaporative cooling; Programmable thermostat
- Interior features: High-speed internet; No interior steps; Bath lever faucets
- Laundry & utility: Laundry inside
Neighborhood map
What this means for you Summary
Snapshot
- This is a 2-bed/1.0-bath manufactured listed at $165k.
Deal economics
- At list price, monthly cash flow is $45 ($544/yr) — positive.
- The deal already cash-flows at list — no discount required.
- To meet the 1% rule (rent ≥ 1% of price), the offer needs to be $150k (9.0% below list).
- Recommended offer: $150k (9.0% below list) — sets the bar for 1% rule.
- Cap rate 6.6% vs local median 3.5% in Glendale — top-decile yield for the area; either an underpriced asset or a hidden risk that comps aren't pricing in. Stress-test before assuming the spread holds.
Location & tenants
- Location reads 76/100 on livability (#12 in AZ, #3,235 nationally) — a middle-class / working-renter tenant base. Strengths: commute A+, housing A+, amenities B; Watch: health & safety D+, crime F.
- Peoria Unified School District (4237) (suburban): math 36% / reading 42% proficiency, ranked #64 of 249 in AZ (top 26%) — families likely to look elsewhere, expect single-tenant / working-renter base with shorter leases.
- Zoned schools: Foothills Elementary School (math 30% / reading 34%, grade F, #505 of 1,109 statewide, top 47%, 604 students, 58% FRL); Cactus High School (math 27% / reading 31%, grade F, #130 of 381 statewide, top 34%, 1,144 students, 44% FRL) — zoned schools average 51% FRL vs 35% district-wide (16 pts higher); higher-poverty schools than district average — tighter screening recommended.
- Market conditions: Rents rising (+1.9%/yr); 92 active listings in the ZIP; 6 comparable units currently listed for rent nearby; rentals leasing fast (median 4d on market — plan ~1-2 weeks tenant-placement turnaround); solid renter incomes; 36,011 units permitted in Maricopa County in 2024 (12,801 in 5+ unit buildings).
Forward outlook
- Local home prices are declining (-3.0%/yr); year-one equity from $1k of loan paydown is wiped out by about $5k of value loss. Plan a longer hold.
- Maricopa County population projected at +38% by 2050 — long-run rental-demand tailwind backs the buy-and-hold thesis.
Negotiation context
- Only 6 days on market — expect competitive offers; lowballing is unlikely to land.
Risks & watch-outs
- Climate carrying-cost: extreme-heat days projected 7→19/yr by 2055 (HVAC capex compounding) — expect insurance premiums to compound above CPI over the hold.
Questions for the listing agent
- Built in 1970 — when were the roof, HVAC, electrical panel, plumbing, and water heater last replaced?
- Is there a deadline driving the sale (1031 exchange, divorce, estate, relocation)? That informs how much negotiation room exists.
- Crime grade is F in this area — have there been break-ins, vandalism, or insurance claims at this property in the last 3 years? What carrier currently insures it and at what premium?
- What's the average days-on-market for RENTAL listings here right now (not sales)? A rising rental-DOM trend means longer vacancies and softer asking-rent achievability than the comps imply.
- What's the recent tenant-quality profile in this submarket — average credit score on applications, eviction rate, late-payment / NSF rate, and stable-employment percentage? A property-management company in the area should have these aggregated.
- How much new for-sale + rental construction is in the pipeline within 1–3 miles? Heavy new supply typically softens prices + rents 12–24 months out; constrained supply supports both.
Investment metrics
- 1% rule
- 0.91% ✗
- Cap rate
- 6.62%
- Cash-on-cash
- 1.18%
- DSCR
- 1.05
- GRM
- 9.2
CMA / ARV
- ARV (on-the-fly)
- $259,200
- Comps found
- 1
Show comp detail 1 sale within ~0.75 mi
| Address | Dist | Beds/Ba | Sqft | Sold | Price | $/sf | Match |
|---|---|---|---|---|---|---|---|
| 7002 W Karen Lee Ln | 0.45mi | 2/1.0 | 673 (-6%) | 17mo | $242,000 | $360 | 54 |
Match score weights: distance 35% · size 25% · config 20% · recency 20%. Top-matched comps best support the ARV.
Projected returns pro-forma
-3.0% appreciation · 1.86% rent growth · sell at horizon
- IRR
- -15.7%
- Equity multiple
- 0.45×
- Total profit
- $-25,528
- Equity at exit
- $24,602
- IRR
- -9.3%
- Equity multiple
- 0.45×
- Total profit
- $-25,244
- Equity at exit
- $14,266
Cash invested: $46,200 (down + closing). Projections, not guarantees.
Landlord ↔ Tenant lean methodology
- Overall (STATE)
- 87 Strongly Landlord-Friendly
- State Arizona
- 87 Strongly Landlord-Friendly · R+3
- County
- — inherits STATE
- City
- — inherits STATE
ZIP-level market 85306
- Rents YoY
- 1.9%
- Active inventory
- 92
- Price-to-rent
- 9.2×
Monthly cashflow live
- Estimated rent
- $1,501 high interval (Pro) →
- Mortgage (P&I)
- −$865
- Tax est. 1.5%
- −$206 /mo · $2,475/yr
- Insurance
- −$69
- HOA
- −$0
- Vacancy / Maint / Mgmt
- −$315
- Net cashflow
- $45
Break-even live
Sensitivity live
| Price | -10% $159 | -5% $102 | +0% $45 | +5% $-12 | +10% $-69 |
|---|---|---|---|---|---|
| Rent | -10% $-73 | -5% $-14 | +0% $45 | +5% $105 | +10% $164 |
| Rate | -1.0pp $128 | -0.5pp $87 | base $45 | +0.5pp $3 | +1.0pp $-41 |
UW: 25.0% down · 7.5% · 30yr · 1.5% tax · 5.0% vac · 8.0% maint · 8.0% mgmt
Financing live
Cash to close
- Down payment
- $41,250
- Closing costs
- $4,950
- Reserves months
- —
- Total cash needed
- —
Loan-product check · same deal, 3 products live
Conventional
25% down · 7.5% · 30yr
- Down + closing
- —
- Monthly P&I
- —
- Monthly cashflow
- —
- DSCR
- —
- Eligible?
- —
Personal DTI + credit; lowest rate.
DSCR
20% down · 8.5% · 30yr
- Down + closing
- —
- Monthly P&I
- —
- Monthly cashflow
- —
- DSCR
- —
- Eligible?
- —
No personal income docs; deal must DSCR.
Hard money
10% down · 12.0% · 12mo
- Down + closing
- —
- Monthly P&I
- —
- Monthly cashflow
- —
- DSCR
- —
- Eligible?
- —
Short-term bridge; refi at stabilization.
Rent comps 6 comps
| Address | Beds | Baths | Sqft | Rent | $/sqft | DOM | Units | Dist |
|---|---|---|---|---|---|---|---|---|
| 6451 W Bell Rd Glendale, AZ | 2.0 | 1.0–2.0 | 630 | $1,285 | $2.04 | 3d | 107 | 0.67mi |
| 5959 W Greenway Rd Glendale, AZ | 1.0–2.0 | 1.0–2.0 | 735 | $1,357 | $1.85 | 0d | 9 | 0.89mi |
| 15050 N 59th Ave Glendale, AZ | 1.0–2.0 | 1.0–2.0 | 775 | $1,499 | $1.93 | 3d | 7 | 0.97mi |
| 16601 N 75th Ave Peoria, AZ | 1.0–3.0 | 1.0–2.0 | 1042 | $1,896 | $1.82 | 0d | 17 | 1.03mi |
| 15010 N 59th Ave Glendale, AZ | 1.0–2.0 | 1.0–2.0 | 637 | $1,445 | $2.27 | 4d | 13 | 1.05mi |
| 15301 N 57th Ave Glendale, AZ | 1.0–3.0 | 1.0–2.0 | 1008 | $1,966 | $1.95 | 0d | 17 | 1.39mi |
Listing history 1 events
-
2026-05-21$165,000 Active
ⓘ Source: listings_history table (triggers on properties + properties_extension) + one-shot
backfill from property_details.listing_events for pre-trigger history.
Climate risk First Street
- Flood 1/10 Low FEMA zone X (shaded) · 0% chance over 30 yrs
- Wildfire 1/10 Low
- Heat 9/10 Extreme 7 d/yr ≥112°F today · 19 d/yr by 30 yrs out
- Wind 1/10 Low
- Air quality 3/10 Moderate 3 unhealthy d/yr today · 3 by 30 yrs out
Nearby sold comps map
Loading sold comps map…
Walkable amenities ~0.75 mi
Loading nearby amenities…
Taxation est. · year 1
- Rental income
- $18,010
- − Mortgage interest
- −$9,243
- − Property taxes
- −$2,475
- − Insurance
- −$825
- − Repairs & maintenance
- −$1,441
- − Management
- −$1,441
- − Depreciation
- −$4,800
- Taxable loss
- −$2,215
- Est. tax savings @ 24.0%
- +$531
- After-tax cash flow
- $1,076/yr
For passive investors: Depreciation is non-cash, so a rental often shows a tax loss while cash-flowing — sheltering income. Rental losses are passive: they offset passive income freely, and up to $25,000/yr can offset ordinary (W-2) income if you actively participate and your MAGI is under $100k (phasing out to $0 by $150k); unused losses carry forward. On sale, claimed depreciation is recaptured at up to 25%, and gains may owe capital-gains tax (a 1031 exchange can defer both). Figures are a year-1 estimate at your 24.0% rate — not tax advice; consult a CPA.
Schools (NCES district)
- District
- Peoria Unified School District (4237)
- NCES district ID
- 0406250
- Math proficiency
- 36% ▼ -14.00%
- Reading proficiency
- 42% ▼ -8.00%
- Median HH income
- $60,171
- Composite
- 34.62/100
- National rank
- #5152
- State rank
- #64 of 249 in AZ
Livability — Glendale
- Score
- 76/100
- State rank
- #12
- US rank
- #3235
Category grades
Schools grade is shown separately in the Schools card above.
Census & demographics
- Census place
- Glendale, AZ
- County
- Maricopa County · 4,537,380 people
- City population
- 294,586
- Metro
- Phoenix-Mesa-Chandler, AZ
- Population (ZIP)
- 24,911
- Household income
- $84,779
- Rent vs Own
- Severe rent burden
- 981.0
Population outlook (Maricopa County) Hauer SSP2
- Today (2025)
- 4,979,203 people
- By 2030
- 5,378,229 · +8.0%
- By 2040
- 6,156,598 · +23.6%
- By 2050
- 6,872,376 · +38.0%
- By 2075
- 8,401,270 · +68.7%
- By 2100
- 9,247,439 · +85.7%
Race, ethnicity, and origin ACS 2023
- Neighborhood character
- Predominantly White (68%)
- Race & ethnicity
- White 68% Hispanic / Latino 21% Two or more races 13% Black 3% Asian 2% Native American 2%
- Hispanic origin (detail)
- Mexican 15%
- Common ancestry
- Romanian 4% Lithuanian 3% Slovak 3%
- Foreign-born
- 10% · Canada, South Korea, China
- Languages at home
- 85% English-only · Spanish 9% Other Indo-European 2% Arabic 1%
Political lean MEDSL · Maricopa
- 2024 margin
- Toss-up / Even · D 47.7% · R 51.2% · Other 1.1%
- 2008→2024 swing
- +7.1pp toward D · 2008: -10.6pp · 2024: -3.5pp
- All cycles
- 2024: R+3.5 2020: D+2.2 2016: R+3.5 2012: R+12.0 2008: R+10.6
Not yet ingested
- Civics
- —
Market trends
- HPI YoY
- ▼ -198.37%
- Current HPI
- 336.9411
- Rent YoY
- ▲ 1.86%
- Metro
- Phoenix-Mesa-Chandler, AZ
- State GDP YoY
- ▲ 4.54%
- F500 in state
- 20
Industry mix (Fortune 500 HQ in AZ)
| Industry | F500 HQs | Revenue |
|---|---|---|
| Technology | 2 | $13B |
|
||
| Mining / Metals | 1 | $23B |
|
||
| Environmental Services | 1 | $16B |
|
||
| Metals / Steel | 1 | $14B |
|
||
| Technology Distribution | 1 | $9B |
|
||
| Homebuilding | 1 | $8B |
|
||
Price history
2 events — show timeline
- 2026-05-27 Pending — ARMLS
- 2026-05-21 Listed $165,000 ARMLS
Property tax history
-5.1%/yrLatest (2025): $287 · +2.3% YoY. Source: county tax records.
Cash-flow waterfall
monthlySold comps — $/sqft
last 12 mo · ≤1 miLoading sold comps…