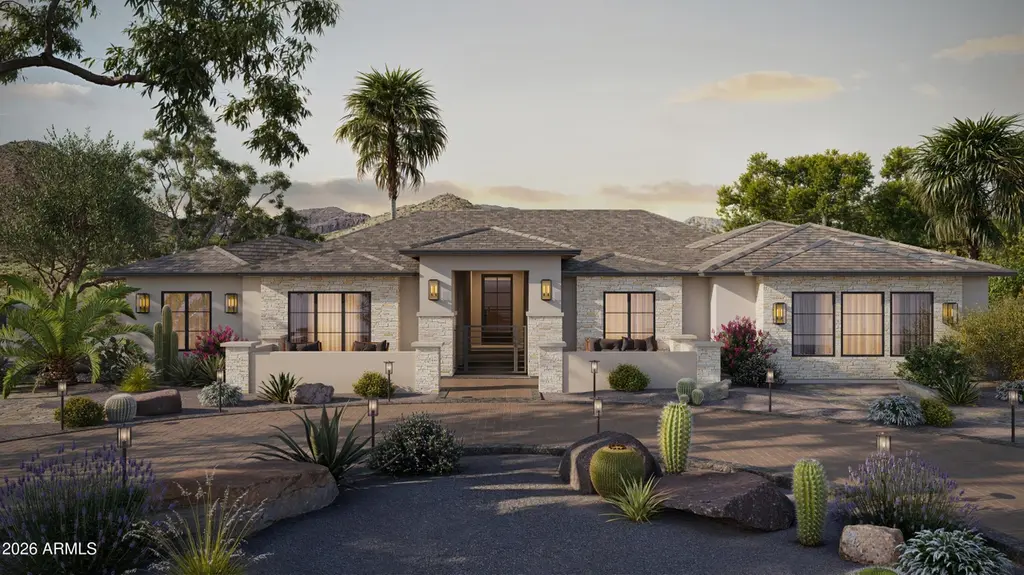
13959 E Montgomery Rd
Scottsdale, AZ 85262
$1,350,000F
5 bd · 4.5 ba ·
4,581 sqft ·
Built 2026
· Land
· Pending
· 59 DOM
Cashflow @ list (25.0% down · 7.5%)
Estimated rent
$5,590/mo
Mortgage (P&I)
−$7,080
Tax + insurance
−$2,250
HOA
−$0
Vac / Maint / Mgmt
−$1,174
Net cashflow
$-4,914/mo
Annual
$-58,966/yr
Cap rate
1.93%
Cash-on-cash
-15.60%
DSCR
0.31
1% rule
0.41%
Cash to close
$378,000
Investor read
- This is a 5-bed/4.5-bath land listed at $1.35M.
- At list price, monthly cash flow is $-5k ($-59k/yr) — negative.
- To cash-flow at today's rent, offer at most $639k (52.7% below list).
- To meet the 1% rule (rent ≥ 1% of price), the offer needs to be $559k (58.6% below list).
- It's been on market 59 days — a 3% lower offer ($1.31M) is reasonable based on typical stale-listing flexibility.
- Recommended offer: $559k (58.6% below list) — sets the bar for 1% rule.
- Local home prices are declining (-3.0%/yr); year-one equity from $9k of loan paydown is wiped out by about $40k of value loss. Plan a longer hold.
- Location reads 80/100 on livability (#4 in AZ, #1,756 nationally) — a professional / high-income tenant draw. Strengths: amenities A+, commute A+, employment A+; Watch: health & safety C-, cost of living F.
- Cave Creek Unified District (4244) (urban): math 57% / reading 59% proficiency, ranked #13 of 249 in AZ (top 5%) — acceptable for families but not a draw, mixed tenant base, ~2y average lease; only 8% free/reduced lunch — higher-income household profile.
- Market conditions: 588 active listings in the ZIP; 1 comparable units currently listed for rent nearby; high-income renter base; 36,011 units permitted in Maricopa County in 2024 (12,801 in 5+ unit buildings).
- Maricopa County population projected at +38% by 2050 — long-run rental-demand tailwind backs the buy-and-hold thesis.
- Cap rate 1.9% vs local median 2.5% in Scottsdale — below-typical yield; the buyer is paying a premium for something (appreciation thesis, condition, location) that the cap rate doesn't capture.
- This rent runs 38% of the median local income ($178k/yr) — at the standard rent-burdened threshold; future hikes will face affordability resistance.
Questions for listing agent
- What do current leases actually rent for vs. the listed asking? Can we see a recent rent roll and the last 12 months of T-12 income?
- It's been on market 59 days. Have you received any prior offers? Is the seller open to a 59% concession, seller financing, or rate buy-down credit?
- Is there a deadline driving the sale (1031 exchange, divorce, estate, relocation)? That informs how much negotiation room exists.
- Schools are A-rated — typically a magnet for longer-tenancy family renters. What's the average tenant stay here, and is there a school-zone premium baked into asking?
- The area grade is low — what's the realistic commute time and amenity access for the typical tenant pool here? Any planned neighborhood developments (good or bad) we should know about?
- What's the average days-on-market for RENTAL listings here right now (not sales)? A rising rental-DOM trend means longer vacancies and softer asking-rent achievability than the comps imply.
- What's the recent tenant-quality profile in this submarket — average credit score on applications, eviction rate, late-payment / NSF rate, and stable-employment percentage? A property-management company in the area should have these aggregated.
- How much new for-sale + rental construction is in the pipeline within 1–3 miles? Heavy new supply typically softens prices + rents 12–24 months out; constrained supply supports both.
CashFlowRE · CFR-MYJESZ2BSP70EC
· Data 6 days ago
cashflowre.app · 2026-05-29