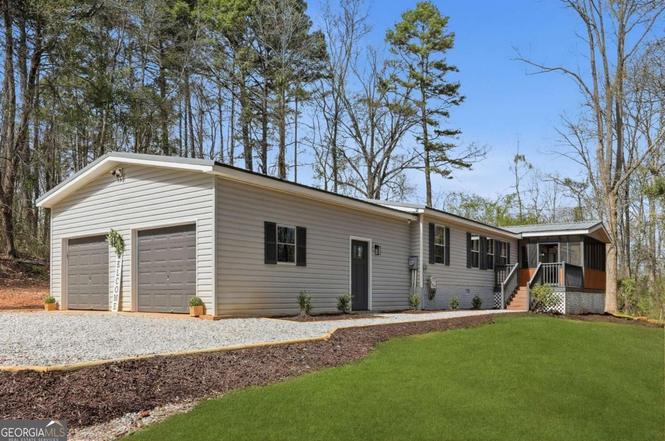
67 Forest Lake Circle Rd
Jefferson, GA 30567
$299,999D
3 bd · 2.0 ba ·
1,680 sqft ·
Built 1994
· Manufactured
· Pending
· 29 DOM
Cashflow @ list (25.0% down · 7.5%)
Estimated rent
$1,901/mo
Mortgage (P&I)
−$1,573
Tax + insurance
−$186
HOA
−$0
Vac / Maint / Mgmt
−$399
Net cashflow
$-257/mo
Annual
$-3,090/yr
Cap rate
5.26%
Cash-on-cash
-3.68%
DSCR
0.84
1% rule
0.63%
Cash to close
$84,000
Investor read
- This is a 3-bed/2.0-bath manufactured listed at $300k.
- At list price, monthly cash flow is $-257 ($-3k/yr) — negative.
- To cash-flow at today's rent, offer at most $255k (15.2% below list).
- To meet the 1% rule (rent ≥ 1% of price), the offer needs to be $190k (36.6% below list).
- It's been on market 29 days — a 2% lower offer ($295k) is reasonable based on typical stale-listing flexibility.
- Recommended offer: $190k (36.6% below list) — sets the bar for 1% rule.
- In year one you build about $32k of equity ($2k loan paydown + $30k appreciation (10.0% local appreciation)).
- Location reads 74/100 on livability (#40 in GA, #4,690 nationally) — a middle-class / working-renter tenant base. Strengths: crime A+, housing A+, employment A; Watch: amenities F, commute F.
- Jackson County (rural): math 38% / reading 37% proficiency, ranked #50 of 174 in GA (top 29%) — families likely to look elsewhere, expect single-tenant / working-renter base with shorter leases.
- Zoned schools: North Jackson Elementary School (math 36% / reading 30%, grade F, #567 of 1,228 statewide, top 47%, 687 students, 43% FRL); East Jackson Middle School (math 38% / reading 36%, grade F, #164 of 470 statewide, top 35%, 544 students, 63% FRL); East Jackson Comprehensive High School (math 28% / reading 28%, grade F, #155 of 424 statewide, top 37%, 1,343 students, 52% FRL).
- Market conditions: 143 active listings in the ZIP; solid renter incomes; 2,167 units permitted in Jackson County in 2024 (59 in 5+ unit buildings).
- Jackson County population projected at +14% by 2050 — modest demand growth; plan on rents tracking national, not racing it.
- 8 sale attempts with the ask held roughly flat each time — persistent listings suggest the price (not the market) is what's stuck; bring a comps-based counter.
- Current owner paid $170k; list at $300k implies a 76% gain — meaningful room to come down on a strong offer.
- By year 2, paydown + projected appreciation supports a ~$52k cash-out refi (75% LTV) — recoverable capital for the next deal without selling this one.
- Climate carrying-cost: extreme-heat days projected 6→15/yr by 2055 (HVAC capex compounding) — expect insurance premiums to compound above CPI over the hold.
- Cap rate 5.3% vs local median 2.8% in Jefferson — top-decile yield for the area; either an underpriced asset or a hidden risk that comps aren't pricing in. Stress-test before assuming the spread holds.
Questions for listing agent
- What do current leases actually rent for vs. the listed asking? Can we see a recent rent roll and the last 12 months of T-12 income?
- Is there a deadline driving the sale (1031 exchange, divorce, estate, relocation)? That informs how much negotiation room exists.
- The area grade is low — what's the realistic commute time and amenity access for the typical tenant pool here? Any planned neighborhood developments (good or bad) we should know about?
- What's the average days-on-market for RENTAL listings here right now (not sales)? A rising rental-DOM trend means longer vacancies and softer asking-rent achievability than the comps imply.
- What's the recent tenant-quality profile in this submarket — average credit score on applications, eviction rate, late-payment / NSF rate, and stable-employment percentage? A property-management company in the area should have these aggregated.
- How much new for-sale + rental construction is in the pipeline within 1–3 miles? Heavy new supply typically softens prices + rents 12–24 months out; constrained supply supports both.
CashFlowRE · CFR-MYVH7Y2DR2EQS7
· Data 1 week ago
cashflowre.app · 2026-05-29