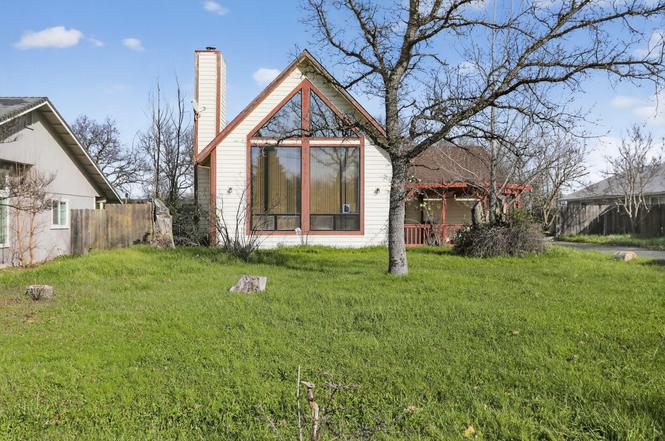
19566 Feather Falls Pl
Lake California, CA 96022
$249,000C+
3 bd · 1.5 ba ·
1,739 sqft ·
Built 1990
· SingleFamily
· Pending
· 144 DOM
Cashflow @ list (25.0% down · 7.5%)
Estimated rent
$2,389/mo
Mortgage (P&I)
−$1,306
Tax + insurance
−$151
HOA
−$0
Vac / Maint / Mgmt
−$502
Net cashflow
$431/mo
Annual
$5,166/yr
Cap rate
8.37%
Cash-on-cash
7.41%
DSCR
1.33
1% rule
0.96%
Cash to close
$69,720
Investor read
- This is a 3-bed/1.5-bath single-family listed at $249k.
- At list price, monthly cash flow is $431 ($5k/yr) — positive.
- The deal already cash-flows at list — no discount required.
- To meet the 1% rule (rent ≥ 1% of price), the offer needs to be $239k (4.1% below list).
- It's been on market 144 days — a 12% lower offer ($219k) is reasonable based on typical stale-listing flexibility.
- Recommended offer: $219k (12.0% below list) — sets the bar for market timing.
- Local home prices are declining (-3.0%/yr); year-one equity from $2k of loan paydown is wiped out by about $7k of value loss. Plan a longer hold.
- Location reads 57/100 on livability (#767 in CA) — a working-class tenant base; expect higher turnover. Strengths: housing A+, employment A-; Watch: amenities F, commute F, cost of living F.
- Evergreen Union (rural): math 33% / reading 49% proficiency, ranked #226 of 517 in CA (top 44%) — families likely to look elsewhere, expect single-tenant / working-renter base with shorter leases.
- Zoned schools: Evergreen Elementary (math 40% / reading 51%, grade D-, #485 of 1,571 statewide, top 31%, 525 students, 59% FRL); Evergreen Middle (math 32% / reading 50%, grade F, #148 of 498 statewide, top 30%, 400 students, 56% FRL); Red Bluff High (math 26% / reading 36%, grade F, #702 of 1,170 statewide, top 61%, 1,618 students, 65% FRL) — zoned schools average 60% FRL vs 42% district-wide (18 pts higher); higher-poverty schools than district average — tighter screening recommended.
- Market conditions: 276 active listings in the ZIP; 2 comparable units currently listed for rent nearby; 186 units permitted in Tehama County in 2024 (0 in 5+ unit buildings).
- Tehama County population projected at -14% by 2050 — secular population decline; favor cash flow + early exit over multi-decade hold.
- 2 sale attempts with the ask held roughly flat each time — persistent listings suggest the price (not the market) is what's stuck; bring a comps-based counter.
- Climate carrying-cost: severe wildfire risk; extreme-heat days projected 7→16/yr by 2055 (HVAC capex compounding) — expect insurance premiums to compound above CPI over the hold.
- Cap rate 8.4% vs local median 3.7% in Lake California — top-decile yield for the area; either an underpriced asset or a hidden risk that comps aren't pricing in. Stress-test before assuming the spread holds.
Questions for listing agent
- It's been on market 144 days. Have you received any prior offers? Is the seller open to a 12% concession, seller financing, or rate buy-down credit?
- Why hasn't it sold? Are there any deal-killer items the seller is aware of (foundation, flood, title, zoning, code violations)?
- Is there a deadline driving the sale (1031 exchange, divorce, estate, relocation)? That informs how much negotiation room exists.
- Schools are F-rated, which usually means shorter tenancies and higher turnover. Who's the typical renter profile here, and what's been the actual vacancy rate?
- What's the average days-on-market for RENTAL listings here right now (not sales)? A rising rental-DOM trend means longer vacancies and softer asking-rent achievability than the comps imply.
- What's the recent tenant-quality profile in this submarket — average credit score on applications, eviction rate, late-payment / NSF rate, and stable-employment percentage? A property-management company in the area should have these aggregated.
- How much new for-sale + rental construction is in the pipeline within 1–3 miles? Heavy new supply typically softens prices + rents 12–24 months out; constrained supply supports both.
CashFlowRE · CFR-N09QW574YDGK8M
· Data 4 weeks ago
cashflowre.app · 2026-05-29