19566 Feather Falls Pl · Lake California, CA
Flood risk 1/10 · Minimal
- FEMA flood zone
- X (unshaded)
- Chance of flooding over 30 yrs
- 0.0%
- Est. flood insurance / yr
- $507 – $1,088
Fire risk 8/10 · Major
- Est. fire insurance / yr
- $659 – $1,223
Heat risk 8/10 · Major
- Hot days now (above 104°F)
- 7 days/yr
- Hot days in 30 yrs
- 16 days/yr
Wind risk 1/10 · Minimal
- Chance of severe wind over 30 yrs
- —
Air-quality risk 10/10 · Severe
- Unhealthy air days now
- 34 days/yr
- Unhealthy air days in 30 yrs
- 41 days/yr
Risk factors via First Street. Map © Google.
Why this score? — see what drove the C+ grade
The composite is a weighted blend of 9 inputs, each scored 0–100. Each bar is that input's sub-score; the figure is the points it added to the 100-point composite (weight × sub-score).
- Cash flow +22.7/30.0
- ARV discount +15.0/15.0
- DSCR +7.3/10.0
- 1% rule +4.6/10.0
- Schools +3.5/10.0
- Livability +2.9/5.0
- Rent growth +2.5/5.0
- Condition / age +2.5/5.0
- Appreciation +0.0/10.0
$249,000
🖨 Deal sheet (PDF) 📄 Offer letter ✓ Due diligence
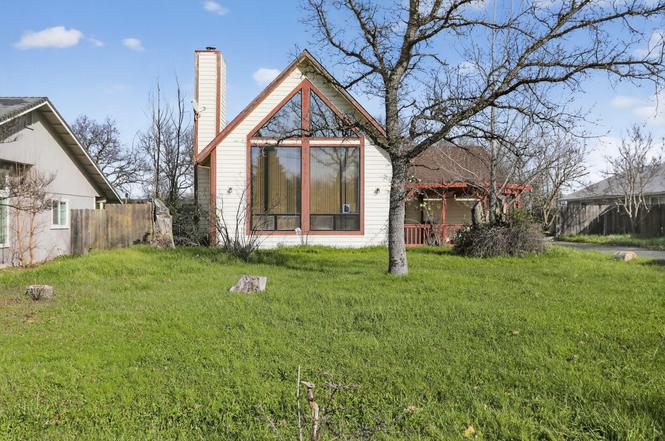
Listing remarks
Step inside this charming A-frame home and imagine the possibilities. The soaring ceilings and striking wall of windows fill the space with warm, natural light, while the stone fireplace creates a cozy centerpiece for the living room. The open kitchen and dining area are ready for your vision, offering the perfect setting to gather with family and friends. Upstairs, the loft adds extra space for a home office, guest room, or quiet retreat. Set on a spacious lot, this property blends privacy, personality, and potential. Conveniently located near I-5 with easy access to Redding and Red Bluff.
Key facts
- Loft
- Spacious lot
- Easy access to i-5
Tags
Neighborhood map
What this means for you Summary
Snapshot
- This is a 3-bed/1.5-bath single-family listed at $249k.
Deal economics
- At list price, monthly cash flow is $431 ($5k/yr) — positive.
- The deal already cash-flows at list — no discount required.
- To meet the 1% rule (rent ≥ 1% of price), the offer needs to be $239k (4.1% below list).
- Recommended offer: $219k (12.0% below list) — sets the bar for market timing.
- Cap rate 8.4% vs local median 3.7% in Lake California — top-decile yield for the area; either an underpriced asset or a hidden risk that comps aren't pricing in. Stress-test before assuming the spread holds.
Location & tenants
- Location reads 57/100 on livability (#767 in CA) — a working-class tenant base; expect higher turnover. Strengths: housing A+, employment A-; Watch: amenities F, commute F, cost of living F.
- Evergreen Union (rural): math 33% / reading 49% proficiency, ranked #226 of 517 in CA (top 44%) — families likely to look elsewhere, expect single-tenant / working-renter base with shorter leases.
- Zoned schools: Evergreen Elementary (math 40% / reading 51%, grade D-, #485 of 1,571 statewide, top 31%, 525 students, 59% FRL); Evergreen Middle (math 32% / reading 50%, grade F, #148 of 498 statewide, top 30%, 400 students, 56% FRL); Red Bluff High (math 26% / reading 36%, grade F, #702 of 1,170 statewide, top 61%, 1,618 students, 65% FRL) — zoned schools average 60% FRL vs 42% district-wide (18 pts higher); higher-poverty schools than district average — tighter screening recommended.
- Market conditions: 276 active listings in the ZIP; 2 comparable units currently listed for rent nearby; 186 units permitted in Tehama County in 2024 (0 in 5+ unit buildings).
Forward outlook
- Local home prices are declining (-3.0%/yr); year-one equity from $2k of loan paydown is wiped out by about $7k of value loss. Plan a longer hold.
- Tehama County population projected at -14% by 2050 — secular population decline; favor cash flow + early exit over multi-decade hold.
Negotiation context
- It's been on market 144 days — a 12% lower offer ($219k) is reasonable based on typical stale-listing flexibility.
- 2 sale attempts with the ask held roughly flat each time — persistent listings suggest the price (not the market) is what's stuck; bring a comps-based counter.
Risks & watch-outs
- Climate carrying-cost: severe wildfire risk; extreme-heat days projected 7→16/yr by 2055 (HVAC capex compounding) — expect insurance premiums to compound above CPI over the hold.
Questions for the listing agent
- It's been on market 144 days. Have you received any prior offers? Is the seller open to a 12% concession, seller financing, or rate buy-down credit?
- Why hasn't it sold? Are there any deal-killer items the seller is aware of (foundation, flood, title, zoning, code violations)?
- Is there a deadline driving the sale (1031 exchange, divorce, estate, relocation)? That informs how much negotiation room exists.
- Schools are F-rated, which usually means shorter tenancies and higher turnover. Who's the typical renter profile here, and what's been the actual vacancy rate?
- What's the average days-on-market for RENTAL listings here right now (not sales)? A rising rental-DOM trend means longer vacancies and softer asking-rent achievability than the comps imply.
- What's the recent tenant-quality profile in this submarket — average credit score on applications, eviction rate, late-payment / NSF rate, and stable-employment percentage? A property-management company in the area should have these aggregated.
- How much new for-sale + rental construction is in the pipeline within 1–3 miles? Heavy new supply typically softens prices + rents 12–24 months out; constrained supply supports both.
Investment metrics
- 1% rule
- 0.96% ✗
- Cap rate
- 8.37%
- Cash-on-cash
- 7.41%
- DSCR
- 1.33
- GRM
- 8.7
CMA / ARV
- ARV (on-the-fly)
- $380,841
- Comps found
- 12
Show comp detail 12 sales within ~0.75 mi
| Address | Dist | Beds/Ba | Sqft | Sold | Price | $/sf | Match |
|---|---|---|---|---|---|---|---|
| 19566 Feather Falls Pl | 0.00mi | 3/2.0 | 1,739 (0%) | 1mo | $249,000 | $143 | 97 |
| 19665 Gazelle Pl | 0.29mi | 3/2.0 | 1,732 (-0%) | 2mo | $338,000 | $195 | 82 |
| 19686 White Horse Pl | 0.40mi | 3/2.0 | 1,802 (+4%) | 2mo | $433,000 | $240 | 72 |
| 19639 Gazelle Pl | 0.28mi | 3/2.0 | 1,578 (-9%) | 2mo | $345,000 | $219 | 67 |
| 19377 Lake California Dr | 0.53mi | 3/2.0 | 1,799 (+4%) | 0mo | $421,500 | $234 | 67 |
| 22153 Oak Run Pl | 0.43mi | 3/2.0 | 1,628 (-6%) | 1mo | $335,000 | $206 | 67 |
| 19485 Bonanza King Dr | 0.56mi | 3/2.0 | 1,701 (-2%) | 3mo | $399,900 | $235 | 66 |
| 21956 Tom Bead Dr | 0.58mi | 3/2.0 | 1,810 (+4%) | 1mo | $335,000 | $185 | 63 |
| 19701 Black Fox Dr | 0.41mi | 3/2.0 | 1,890 (+9%) | 2mo | $410,000 | $217 | 63 |
| 22103 Table Mountain Pl | 0.28mi | 4/2.0 (+1) | 1,928 (+11%) | 2mo | $419,000 | $217 | 60 |
| 22546 River View Dr | 0.66mi | 3/2.0 | 1,802 (+4%) | 4mo | $435,000 | $241 | 58 |
| 19691 Sweet Brier Pl | 0.43mi | 3/2.0 | 1,562 (-10%) | 4mo | $464,000 | $297 | 58 |
Match score weights: distance 35% · size 25% · config 20% · recency 20%. Top-matched comps best support the ARV.
Projected returns pro-forma
-3.0% appreciation · 3.0% rent growth · sell at horizon
- IRR
- -5.0%
- Equity multiple
- 0.81×
- Total profit
- $-13,056
- Equity at exit
- $37,127
- IRR
- 4.6%
- Equity multiple
- 1.34×
- Total profit
- $23,424
- Equity at exit
- $21,529
Cash invested: $69,720 (down + closing). Projections, not guarantees.
Landlord ↔ Tenant lean methodology
- Overall (STATE)
- 18 Strongly Tenant-Friendly
- State California
- 18 Strongly Tenant-Friendly · D+13
- County
- — inherits STATE
- City
- — inherits STATE
ZIP-level market 96022
- Home prices YoY
- -12.9%
- Active inventory
- 276
- Price-to-rent
- 8.7×
Monthly cashflow live
- Estimated rent
- $2,389 medium interval (Pro) →
- Mortgage (P&I)
- −$1,306
- Tax from tax record
- −$47 /mo · $564/yr
- Insurance
- −$104
- HOA
- −$0
- Vacancy / Maint / Mgmt
- −$502
- Net cashflow
- $431
Break-even live
Sensitivity live
| Price | -10% $571 | -5% $501 | +0% $431 | +5% $360 | +10% $290 |
|---|---|---|---|---|---|
| Rent | -10% $242 | -5% $336 | +0% $431 | +5% $525 | +10% $619 |
| Rate | -1.0pp $556 | -0.5pp $494 | base $431 | +0.5pp $366 | +1.0pp $300 |
UW: 25.0% down · 7.5% · 30yr · 1.5% tax · 5.0% vac · 8.0% maint · 8.0% mgmt
Financing live
Cash to close
- Down payment
- $62,250
- Closing costs
- $7,470
- Reserves months
- —
- Total cash needed
- —
Loan-product check · same deal, 3 products live
Conventional
25% down · 7.5% · 30yr
- Down + closing
- —
- Monthly P&I
- —
- Monthly cashflow
- —
- DSCR
- —
- Eligible?
- —
Personal DTI + credit; lowest rate.
DSCR
20% down · 8.5% · 30yr
- Down + closing
- —
- Monthly P&I
- —
- Monthly cashflow
- —
- DSCR
- —
- Eligible?
- —
No personal income docs; deal must DSCR.
Hard money
10% down · 12.0% · 12mo
- Down + closing
- —
- Monthly P&I
- —
- Monthly cashflow
- —
- DSCR
- —
- Eligible?
- —
Short-term bridge; refi at stabilization.
Rent comps 2 comps
| Address | Beds | Baths | Sqft | Rent | $/sqft | DOM | Units | Dist |
|---|---|---|---|---|---|---|---|---|
| 21967 Klamath River Pl Unit A Cottonwood, CA | 3.0 | 2.0 | 1250 | $2,095 | $1.68 | 22d | 1 | 0.55mi |
| 19959 Indian Tom Dr Cottonwood, CA | 3.0 | 2.0 | 1682 | $2,700 | $1.61 | 22d | 1 | 0.78mi |
Listing history 5 events
-
2026-05-22soldstatus $249,000 Closed
-
2026-04-13status Pending
-
2026-02-18status Active
-
2026-02-05status Pending
-
2025-11-07$249,000 Active
ⓘ Source: listings_history table (triggers on properties + properties_extension) + one-shot
backfill from property_details.listing_events for pre-trigger history.
Tax reassessment forecast CA · Resets to sale price
- Current annual tax
- $564 · $47/mo
- Projected year-2 tax
- $1,892 · $158/mo
- Expected delta
- +$1,329/yr (+$111/mo · 235.7%)
ⓘ Screening estimate from a state-policy table — verify with the county assessor before closing.
Climate risk First Street
- Flood 1/10 Low FEMA zone X (unshaded) · 0% chance over 30 yrs
- Wildfire 8/10 Severe
- Heat 8/10 Severe 7 d/yr ≥104°F today · 16 d/yr by 30 yrs out
- Wind 1/10 Low
- Air quality 10/10 Extreme 34 unhealthy d/yr today · 41 by 30 yrs out
Nearby sold comps map
Loading sold comps map…
Walkable amenities ~0.75 mi
Loading nearby amenities…
Taxation est. · year 1
- Rental income
- $28,663
- − Mortgage interest
- −$13,948
- − Property taxes
- −$564
- − Insurance
- −$1,245
- − Repairs & maintenance
- −$2,293
- − Management
- −$2,293
- − Depreciation
- −$7,244
- Taxable income
- $1,077
- Est. tax owed @ 24.0%
- −$259
- After-tax cash flow
- $4,908/yr
For passive investors: Depreciation is non-cash, so a rental often shows a tax loss while cash-flowing — sheltering income. Rental losses are passive: they offset passive income freely, and up to $25,000/yr can offset ordinary (W-2) income if you actively participate and your MAGI is under $100k (phasing out to $0 by $150k); unused losses carry forward. On sale, claimed depreciation is recaptured at up to 25%, and gains may owe capital-gains tax (a 1031 exchange can defer both). Figures are a year-1 estimate at your 24.0% rate — not tax advice; consult a CPA.
Schools (NCES district)
- District
- Evergreen Union
- NCES district ID
- 0613170
- Math proficiency
- 33% ▼ -8.00%
- Reading proficiency
- 49% ▼ -3.00%
- Median HH income
- $49,783
- Composite
- 35.24/100
- National rank
- #4978
- State rank
- #226 of 517 in CA
Livability — Lake California
- Score
- 57/100
- State rank
- #767
- US rank
- #22243
Category grades
Schools grade is shown separately in the Schools card above.
Census & demographics
- Census place
- Lake California, CA
- Population (ZIP)
- 16,497
Population outlook (Tehama County) Hauer SSP2
- Today (2025)
- 61,058 people
- By 2030
- 59,493 · -2.6%
- By 2040
- 56,076 · -8.2%
- By 2050
- 52,372 · -14.2%
- By 2075
- 43,895 · -28.1%
- By 2100
- 34,186 · -44.0%
Race, ethnicity, and origin ACS 2023
- Neighborhood character
- Predominantly White (77%)
- Race & ethnicity
- White 77% Hispanic / Latino 11% Two or more races 11% Asian 3% Native American 1%
- Hispanic origin (detail)
- Mexican 8%
- Common ancestry
- Lithuanian 5% Slovak 4% Portuguese 3%
- Foreign-born
- 4% · Canada, China
- Languages at home
- 92% English-only · Spanish 3% Other Indo-European 2% Other Asian/Pacific 1%
Political lean MEDSL · Tehama
- 2024 margin
- Solid R (+41.8) · D 27.9% · R 69.7% · Other 2.3%
- 2008→2024 swing
- -17.7pp toward R · 2008: -24.1pp · 2024: -41.8pp
- All cycles
- 2024: R+41.8 2020: R+35.6 2016: R+36.8 2012: R+27.4 2008: R+24.1
Not yet ingested
- Civics
- —
Market trends
- HPI YoY
- ▼ -54.22%
- Current HPI
- 364.3174
- Rent YoY
- —
- Metro
- —
- State GDP YoY
- ▲ 3.21%
- F500 in state
- 116
Industry mix (Fortune 500 HQ in CA)
| Industry | F500 HQs | Revenue |
|---|---|---|
| Technology | 27 | $1,492B |
|
||
| Financial Services | 3 | $174B |
|
||
| Retail | 3 | $44B |
|
||
| Insurance | 3 | $26B |
|
||
| Media / Entertainment | 2 | $115B |
|
||
| Pharmaceuticals / Biotech | 2 | $62B |
|
||
Price history
+0.0% since first listed5 events — show timeline
- 2026-05-22 Sold (MLS) $249,000 SAOR
- 2026-04-13 Pending — SAOR
- 2026-02-18 Relisted — SAOR
- 2026-02-05 Pending — SAOR
- 2025-11-07 Listed $249,000 SAOR
Property tax history
-2.4%/yrLatest (2025): $564 · -2.6% YoY. Source: county tax records.
Cash-flow waterfall
monthlySold comps — $/sqft
last 12 mo · ≤1 miLoading sold comps…