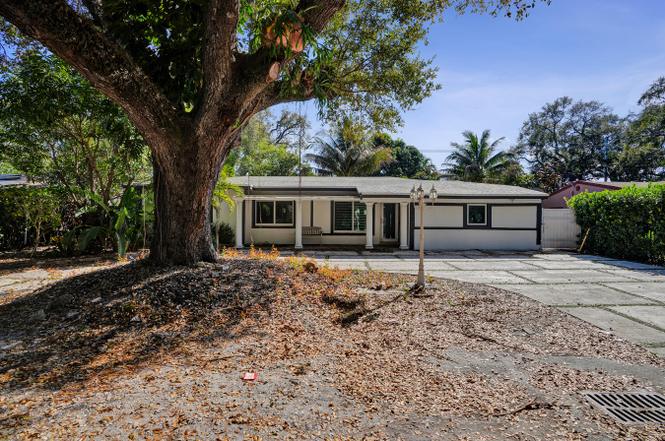
640 NE 160th St
Golden Glades, FL 33162
$480,000D+
3 bd · 2.0 ba ·
1,462 sqft ·
Built 1953
· SingleFamily
· Pending
· 49 DOM
Cashflow @ list (25.0% down · 7.5%)
Estimated rent
$4,596/mo
Mortgage (P&I)
−$2,517
Tax + insurance
−$1,005
HOA
−$0
Vac / Maint / Mgmt
−$965
Net cashflow
$109/mo
Annual
$1,304/yr
Cap rate
6.56%
Cash-on-cash
0.97%
DSCR
1.04
1% rule
0.96%
Cash to close
$134,400
Investor read
- This is a 3-bed/2.0-bath single-family listed at $480k.
- At list price, monthly cash flow is $109 ($1k/yr) — positive.
- The deal already cash-flows at list — no discount required.
- To meet the 1% rule (rent ≥ 1% of price), the offer needs to be $460k (4.2% below list).
- It's been on market 49 days — a 3% lower offer ($466k) is reasonable based on typical stale-listing flexibility.
- Recommended offer: $460k (4.2% below list) — sets the bar for 1% rule.
- Local home prices are declining (-3.0%/yr); year-one equity from $3k of loan paydown is wiped out by about $14k of value loss. Plan a longer hold.
- Location reads 74/100 on livability (#281 in FL, #4,513 nationally) — a middle-class / working-renter tenant base. Strengths: commute A+, housing B+, health & safety B+; Watch: employment D, amenities F.
- Miami-Dade (suburban): math 45% / reading 54% proficiency, ranked #40 of 73 in FL (top 55%) — families likely to look elsewhere, expect single-tenant / working-renter base with shorter leases; 64% free/reduced lunch — lower-income household profile, screen leases tightly.
- Zoned schools: Oak Grove Elementary School (math 29% / reading 36%, grade F, #1,787 of 2,144 statewide, top 84%, 472 students, 80% FRL); John F. Kennedy Middle School (math 47% / reading 55%, grade C, #237 of 571 statewide, top 43%, 1,074 students, 67% FRL); North Miami Beach Senior High (math 13% / reading 24%, grade F, #568 of 667 statewide, top 85%, 1,149 students, 66% FRL).
- Zoned-school proficiency averages 34% at this address vs 50% district-wide (-16 pts) — the specific schools serving this property underperform the Miami-Dade average; the district grade overstates school quality for this exact location.
- Watch-outs: built in 1953 — expect roof / HVAC / electrical / plumbing capex.
- Market conditions: Rents soft (-1.6%/yr); 287 active listings in the ZIP; 10,051 units permitted in Miami-Dade County in 2024 (7,758 in 5+ unit buildings).
- Miami-Dade County population projected at +28% by 2050 — long-run rental-demand tailwind backs the buy-and-hold thesis.
- 8 sale attempts since 20y ago; this cycle's ask has dropped $85k (15%) from the opening price — seller is motivated, your offer sets the floor, not the list.
- Current owner paid $140k; list at $480k implies a 243% gain — meaningful room to come down on a strong offer.
- Climate carrying-cost: severe wind risk, 99% chance of damaging wind over 30y; extreme-heat days projected 7→27/yr by 2055 (HVAC capex compounding) — expect insurance premiums to compound above CPI over the hold.
- Cap rate 6.6% vs local median 3.6% in Golden Glades — top-decile yield for the area; either an underpriced asset or a hidden risk that comps aren't pricing in. Stress-test before assuming the spread holds.
Questions for listing agent
- It's been on market 49 days. Have you received any prior offers? Is the seller open to a 4% concession, seller financing, or rate buy-down credit?
- Built in 1953 — when were the roof, HVAC, electrical panel, plumbing, and water heater last replaced?
- Is there a deadline driving the sale (1031 exchange, divorce, estate, relocation)? That informs how much negotiation room exists.
- The area grade is low — what's the realistic commute time and amenity access for the typical tenant pool here? Any planned neighborhood developments (good or bad) we should know about?
- What's the average days-on-market for RENTAL listings here right now (not sales)? A rising rental-DOM trend means longer vacancies and softer asking-rent achievability than the comps imply.
- What's the recent tenant-quality profile in this submarket — average credit score on applications, eviction rate, late-payment / NSF rate, and stable-employment percentage? A property-management company in the area should have these aggregated.
- How much new for-sale + rental construction is in the pipeline within 1–3 miles? Heavy new supply typically softens prices + rents 12–24 months out; constrained supply supports both.
CashFlowRE · CFR-N2H6ZXCAE90WQE
· Data 4 weeks ago
cashflowre.app · 2026-05-29