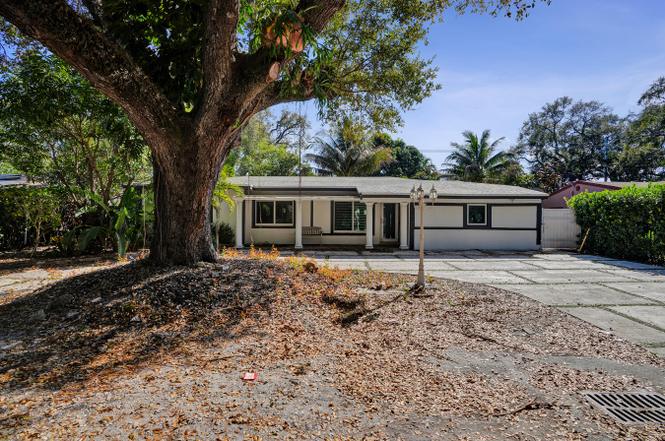
640 NE 160th St · Golden Glades, FL
Flood risk 4/10 · Minor
- FEMA flood zone
- X (shaded)
- Chance of flooding over 30 yrs
- 0.13%
- Est. flood insurance / yr
- $507 – $1,088
Fire risk 1/10 · Minimal
- Est. fire insurance / yr
- $947 – $1,759
Heat risk 10/10 · Severe
- Hot days now (above 104°F)
- 7 days/yr
- Hot days in 30 yrs
- 27 days/yr
Wind risk 10/10 · Severe
- Chance of severe wind over 30 yrs
- 99.0%
Air-quality risk 2/10 · Minimal
- Unhealthy air days now
- 1 days/yr
- Unhealthy air days in 30 yrs
- 2 days/yr
Risk factors via First Street. Map © Google.
Why this score? — see what drove the D+ grade
The composite is a weighted blend of 9 inputs, each scored 0–100. Each bar is that input's sub-score; the figure is the points it added to the 100-point composite (weight × sub-score).
- Cash flow +14.5/30.0
- ARV discount +13.2/15.0
- 1% rule +4.6/10.0
- DSCR +4.4/10.0
- Schools +4.2/10.0
- Livability +3.7/5.0
- Condition / age +2.5/5.0
- Rent growth +2.1/5.0
- Appreciation +0.0/10.0
$480,000
🖨 Deal sheet (PDF) 📄 Offer letter ✓ Due diligence
Listing remarks
Spacious and beautifully updated, this 3-bedroom, 2-bath home offers comfort, style, and peace of mind. Recent upgrades include impact windows, a newer roof, and a modern kitchen designed for everyday living and entertaining. The excellent floor plan features a bright family room, all-tile flooring, and fresh interior paint throughout. Enjoy relaxing on the screened porch overlooking a lush, fenced backyard with mature landscaping and an automatic sprinkler system. Additional highlights include a workshop, a 2-car garage with openers, and plenty of room for storage and hobbies. Located in a welcoming neighborhood with great neighbors, this well-maintained home truly has it all.
Key facts
- Newer roof
- Screened porch
- Modern kitchen
Tags
Property features AI
Finance
- Other: Property listed as resale
Exterior
- Parking: 8 total parking spaces; Attached 2-car garage; Driveway; 2 covered spaces; Open parking available
- Utilities: Public water; Public sewer; No additional utility info provided
- Home design: Single family residence; One story; Resale property; Faces north
- Construction: Block/CBS construction; Shingle roof; Built as of other source (year not provided)
- Exterior features: Back yard fencing; Not waterfront
Interior
- Kitchen: Dishwasher; Electric range; Microwave; Refrigerator; Freezer; Disposal; Electric water heater
- Bedrooms: 4 main-level bedrooms
- Flooring: Tile
- Bathrooms: 2 full bathrooms
- Heating & cooling: Central heating; Central air; Ceiling fans
- Interior features: Built-in features; Walk-in closets; Blinds and sliding windows
- Laundry & utility: In-unit laundry on the main level
Neighborhood map
What this means for you Summary
Snapshot
- This is a 3-bed/2.0-bath single-family listed at $480k.
Deal economics
- At list price, monthly cash flow is $109 ($1k/yr) — positive.
- The deal already cash-flows at list — no discount required.
- To meet the 1% rule (rent ≥ 1% of price), the offer needs to be $460k (4.2% below list).
- Recommended offer: $460k (4.2% below list) — sets the bar for 1% rule.
- Cap rate 6.6% vs local median 3.6% in Golden Glades — top-decile yield for the area; either an underpriced asset or a hidden risk that comps aren't pricing in. Stress-test before assuming the spread holds.
Location & tenants
- Location reads 74/100 on livability (#281 in FL, #4,513 nationally) — a middle-class / working-renter tenant base. Strengths: commute A+, housing B+, health & safety B+; Watch: employment D, amenities F.
- Miami-Dade (suburban): math 45% / reading 54% proficiency, ranked #40 of 73 in FL (top 55%) — families likely to look elsewhere, expect single-tenant / working-renter base with shorter leases; 64% free/reduced lunch — lower-income household profile, screen leases tightly.
- Zoned schools: Oak Grove Elementary School (math 29% / reading 36%, grade F, #1,787 of 2,144 statewide, top 84%, 472 students, 80% FRL); John F. Kennedy Middle School (math 47% / reading 55%, grade C, #237 of 571 statewide, top 43%, 1,074 students, 67% FRL); North Miami Beach Senior High (math 13% / reading 24%, grade F, #568 of 667 statewide, top 85%, 1,149 students, 66% FRL).
- Zoned-school proficiency averages 34% at this address vs 50% district-wide (-16 pts) — the specific schools serving this property underperform the Miami-Dade average; the district grade overstates school quality for this exact location.
- Market conditions: Rents soft (-1.6%/yr); 287 active listings in the ZIP; 10,051 units permitted in Miami-Dade County in 2024 (7,758 in 5+ unit buildings).
Forward outlook
- Local home prices are declining (-3.0%/yr); year-one equity from $3k of loan paydown is wiped out by about $14k of value loss. Plan a longer hold.
- Miami-Dade County population projected at +28% by 2050 — long-run rental-demand tailwind backs the buy-and-hold thesis.
Negotiation context
- It's been on market 49 days — a 3% lower offer ($466k) is reasonable based on typical stale-listing flexibility.
- 8 sale attempts since 20y ago; this cycle's ask has dropped $85k (15%) from the opening price — seller is motivated, your offer sets the floor, not the list.
- Current owner paid $140k; list at $480k implies a 243% gain — meaningful room to come down on a strong offer.
Risks & watch-outs
- Watch-outs: built in 1953 — expect roof / HVAC / electrical / plumbing capex.
- Climate carrying-cost: severe wind risk, 99% chance of damaging wind over 30y; extreme-heat days projected 7→27/yr by 2055 (HVAC capex compounding) — expect insurance premiums to compound above CPI over the hold.
Questions for the listing agent
- It's been on market 49 days. Have you received any prior offers? Is the seller open to a 4% concession, seller financing, or rate buy-down credit?
- Built in 1953 — when were the roof, HVAC, electrical panel, plumbing, and water heater last replaced?
- Is there a deadline driving the sale (1031 exchange, divorce, estate, relocation)? That informs how much negotiation room exists.
- The area grade is low — what's the realistic commute time and amenity access for the typical tenant pool here? Any planned neighborhood developments (good or bad) we should know about?
- What's the average days-on-market for RENTAL listings here right now (not sales)? A rising rental-DOM trend means longer vacancies and softer asking-rent achievability than the comps imply.
- What's the recent tenant-quality profile in this submarket — average credit score on applications, eviction rate, late-payment / NSF rate, and stable-employment percentage? A property-management company in the area should have these aggregated.
- How much new for-sale + rental construction is in the pipeline within 1–3 miles? Heavy new supply typically softens prices + rents 12–24 months out; constrained supply supports both.
Investment metrics
- 1% rule
- 0.96% ✗
- Cap rate
- 6.56%
- Cash-on-cash
- 0.97%
- DSCR
- 1.04
- GRM
- 8.7
CMA / ARV
- ARV (on-the-fly)
- $549,712
- Comps found
- 7
Show comp detail 7 sales within ~0.75 mi
| Address | Dist | Beds/Ba | Sqft | Sold | Price | $/sf | Match |
|---|---|---|---|---|---|---|---|
| 535 NE 162nd St | 0.22mi | 3/2.0 | 1,601 (+10%) | 7mo | $505,000 | $315 | 68 |
| 15615 NE 5th Ct | 0.25mi | 3/2.0 | 1,309 (-10%) | 5mo | $335,000 | $256 | 67 |
| 285 NE 165th St | 0.60mi | 3/2.0 | 1,380 (-6%) | 1mo | $405,000 | $293 | 62 |
| 150 NE 164th St | 0.68mi | 3/2.0 | 1,408 (-4%) | 2mo | $575,000 | $408 | 61 |
| 341 NE 164th St | 0.47mi | 3/2.0 | 1,264 (-14%) | 3mo | $474,999 | $376 | 53 |
| 631 NE 171st St | 0.74mi | 4/2.0 (+1) | 1,468 (+0%) | 13mo | $490 | — | 49 |
| 17001 NE 8th Pl | 0.74mi | 3/2.0 | 1,562 (+7%) | 14mo | $802,000 | $513 | 42 |
Match score weights: distance 35% · size 25% · config 20% · recency 20%. Top-matched comps best support the ARV.
Projected returns pro-forma
-3.0% appreciation · 0.0% rent growth · sell at horizon
- IRR
- -18.3%
- Equity multiple
- 0.37×
- Total profit
- $-84,132
- Equity at exit
- $71,570
- IRR
- -18.6%
- Equity multiple
- 0.14×
- Total profit
- $-115,607
- Equity at exit
- $41,502
Cash invested: $134,400 (down + closing). Projections, not guarantees.
Landlord ↔ Tenant lean methodology
- Overall (STATE)
- 87 Strongly Landlord-Friendly
- State Florida
- 87 Strongly Landlord-Friendly · R+3
- County
- — inherits STATE
- City
- — inherits STATE
ZIP-level market 33162
- Rents YoY
- -1.6%
- Active inventory
- 287
- Price-to-rent
- 8.7×
Monthly cashflow live
- Estimated rent
- $4,596 medium interval (Pro) →
- Mortgage (P&I)
- −$2,517
- Tax from tax record
- −$805 /mo · $9,661/yr
- Insurance
- −$200
- HOA
- −$0
- Vacancy / Maint / Mgmt
- −$965
- Net cashflow
- $109
Break-even live
Sensitivity live
| Price | -10% $380 | -5% $245 | +0% $109 | +5% $-27 | +10% $-163 |
|---|---|---|---|---|---|
| Rent | -10% $-254 | -5% $-73 | +0% $109 | +5% $290 | +10% $472 |
| Rate | -1.0pp $350 | -0.5pp $231 | base $109 | +0.5pp $-16 | +1.0pp $-142 |
UW: 25.0% down · 7.5% · 30yr · 1.5% tax · 5.0% vac · 8.0% maint · 8.0% mgmt
Financing live
Cash to close
- Down payment
- $120,000
- Closing costs
- $14,400
- Reserves months
- —
- Total cash needed
- —
Loan-product check · same deal, 3 products live
Conventional
25% down · 7.5% · 30yr
- Down + closing
- —
- Monthly P&I
- —
- Monthly cashflow
- —
- DSCR
- —
- Eligible?
- —
Personal DTI + credit; lowest rate.
DSCR
20% down · 8.5% · 30yr
- Down + closing
- —
- Monthly P&I
- —
- Monthly cashflow
- —
- DSCR
- —
- Eligible?
- —
No personal income docs; deal must DSCR.
Hard money
10% down · 12.0% · 12mo
- Down + closing
- —
- Monthly P&I
- —
- Monthly cashflow
- —
- DSCR
- —
- Eligible?
- —
Short-term bridge; refi at stabilization.
Listing history 21 events
-
2026-04-29status Pending
-
2026-04-23price $480,000
-
2026-04-08price $499,000
-
2026-04-02price $515,000
-
2026-03-26price $545,000
-
2026-03-11$565,000 Active
-
2026-02-23status Active
-
2026-01-22status Active
-
2025-12-29status Pending
-
2025-11-20historical Active Under Contract
-
2025-10-15status Active
-
2025-10-07historical Active Under Contract
-
2025-10-01$500,000 Active
-
2024-10-16historical $2,800
-
2024-09-11$2,800
-
2024-09-03historical
-
2024-07-21$2,800 Active
-
2006-07-31$349,000
-
2003-05-27soldstatus $140,000
-
1980-10-01soldstatus $75,000
-
1980-04-01soldstatus $40,900
ⓘ Source: listings_history table (triggers on properties + properties_extension) + one-shot
backfill from property_details.listing_events for pre-trigger history.
Tax reassessment forecast FL · Resets to sale price
- Current annual tax
- $9,661 · $805/mo
- Projected year-2 tax
- $9,661 · $805/mo
- Expected delta
- $0/yr ($0/mo · 0.0%)
ⓘ Screening estimate from a state-policy table — verify with the county assessor before closing.
Climate risk First Street
- Flood 4/10 Moderate FEMA zone X (shaded) · 13% chance over 30 yrs
- Wildfire 1/10 Low
- Heat 10/10 Extreme 7 d/yr ≥104°F today · 27 d/yr by 30 yrs out
- Wind 10/10 Extreme 99% chance of damaging wind over 30 yrs
- Air quality 2/10 Low 1 unhealthy d/yr today · 2 by 30 yrs out
Nearby sold comps map
Loading sold comps map…
Walkable amenities ~0.75 mi
Loading nearby amenities…
Taxation est. · year 1
- Rental income
- $55,154
- − Mortgage interest
- −$26,887
- − Property taxes
- −$9,661
- − Insurance
- −$2,400
- − Repairs & maintenance
- −$4,412
- − Management
- −$4,412
- − Depreciation
- −$13,964
- Taxable loss
- −$6,583
- Est. tax savings @ 24.0%
- +$1,580
- After-tax cash flow
- $2,884/yr
For passive investors: Depreciation is non-cash, so a rental often shows a tax loss while cash-flowing — sheltering income. Rental losses are passive: they offset passive income freely, and up to $25,000/yr can offset ordinary (W-2) income if you actively participate and your MAGI is under $100k (phasing out to $0 by $150k); unused losses carry forward. On sale, claimed depreciation is recaptured at up to 25%, and gains may owe capital-gains tax (a 1031 exchange can defer both). Figures are a year-1 estimate at your 24.0% rate — not tax advice; consult a CPA.
Schools (NCES district)
- District
- Miami-Dade
- NCES district ID
- 1200390
- Math proficiency
- 45% ▼ -16.00%
- Reading proficiency
- 54% ▼ -5.00%
- Median HH income
- $43,928
- Composite
- 41.76/100
- National rank
- #3397
- State rank
- #40 of 73 in FL
Livability — Golden Glades
- Score
- 74/100
- State rank
- #281
- US rank
- #4513
Category grades
Schools grade is shown separately in the Schools card above.
Census & demographics
- Census place
- Golden Glades, FL
- County
- Miami-Dade County · 2,697,751 people
- Metro
- Miami-Fort Lauderdale-Pompano Beach, FL
- Population (ZIP)
- 46,606
- Household income
- $60,692
- Rent vs Own
- Severe rent burden
- 2509.0
Population outlook (Miami-Dade County) Hauer SSP2
- Today (2025)
- 3,126,439 people
- By 2030
- 3,325,765 · +6.4%
- By 2040
- 3,697,561 · +18.3%
- By 2050
- 4,012,134 · +28.3%
- By 2075
- 4,605,612 · +47.3%
- By 2100
- 4,866,598 · +55.7%
Race, ethnicity, and origin ACS 2023
- Neighborhood character
- Diverse neighborhood (Simpson 0.62)
- Race & ethnicity
- Black 53% Hispanic / Latino 30% Two or more races 15% White 12% Asian 2%
- Hispanic origin (detail)
- Puerto Rican 4% Cuban 7% Dominican 3%
- Common ancestry
- Hispanic 31% Romanian 1% Scotch-Irish 1%
- Foreign-born
- 52% · Canada, Jamaica, Dominican Republic
- Languages at home
- 29% English-only · French/Haitian/Cajun 35% Spanish 30% Other Indo-European 2%
Political lean MEDSL · Miami-Dade
- 2024 margin
- R (+11.4) · D 43.9% · R 55.4%
- 2008→2024 swing
- -27.6pp toward R · 2008: 16.1pp · 2024: -11.4pp
- All cycles
- 2024: R+11.4 2020: D+7.3 2016: D+29.6 2012: D+23.7 2008: D+16.1
Not yet ingested
- Civics
- —
Market trends
- HPI YoY
- ▼ -445.57%
- Current HPI
- 596.6178
- Rent YoY
- ▼ -1.59%
- Metro
- Miami-Fort Lauderdale-Pompano Beach, FL
- State GDP YoY
- ▲ 3.28%
- F500 in state
- 36
Industry mix (Fortune 500 HQ in FL)
| Industry | F500 HQs | Revenue |
|---|---|---|
| Industrial Technology | 2 | $29B |
|
||
| Insurance | 2 | $17B |
|
||
| Retail | 1 | $60B |
|
||
| Technology Distribution | 1 | $58B |
|
||
| Homebuilding | 1 | $35B |
|
||
| Technology Manufacturing | 1 | $35B |
|
||
Price history
+1073.6% since first listed21 events — show timeline
- 2026-04-29 Pending — Beaches MLS
- 2026-04-23 Price Changed $480,000 Beaches MLS
- 2026-04-08 Price Changed $499,000 Beaches MLS
- 2026-04-02 Price Changed $515,000 Beaches MLS
- 2026-03-26 Price Changed $545,000 Beaches MLS
- 2026-03-11 Listed $565,000 Beaches MLS
- 2026-02-23 Relisted — MARMLS
- 2026-01-22 Relisted — MARMLS
- 2025-12-29 Pending — MARMLS
- 2025-11-20 Contingent — MARMLS
- 2025-10-15 Relisted — MARMLS
- 2025-10-07 Contingent — MARMLS
- 2025-10-01 Listed $500,000 MARMLS
- 2024-10-16 Rental Removed $2,800 MARMLS
- 2024-09-11 Listed for Rent $2,800 MARMLS
- 2024-09-03 Listing Removed — MARMLS
- 2024-07-21 Listed $2,800 MARMLS
- 2006-07-31 Listed $349,000 MARMLS
- 2003-05-27 Sold (Public Records) $140,000 Public Records
- 1980-10-01 Sold (Public Records) $75,000 Public Records
- 1980-04-01 Sold (Public Records) $40,900 Public Records
Property tax history
+14.0%/yrLatest (2025): $9,661 · +4.0% YoY. Source: county tax records.
Cash-flow waterfall
monthlySold comps — $/sqft
last 12 mo · ≤1 miLoading sold comps…