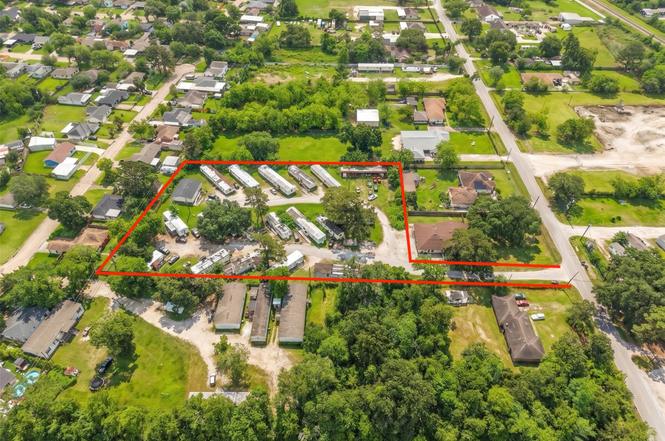
15603 N Brentwood St
Channelview, TX 77530
$1,500,000F
3 bd · 2.0 ba ·
1,064 sqft ·
Built 1985
· Manufactured
· Active
· 2 DOM
Cashflow @ list (25.0% down · 7.5%)
Estimated rent
$1,973/mo
Mortgage (P&I)
−$7,866
Tax + insurance
−$2,500
HOA
−$0
Vac / Maint / Mgmt
−$414
Net cashflow
$-8,807/mo
Annual
$-105,687/yr
Cap rate
-0.75%
Cash-on-cash
-25.16%
DSCR
-0.12
1% rule
0.13%
Cash to close
$420,000
Investor read
- This is a 3-bed/2.0-bath manufactured listed at $1.50M.
- At list price, monthly cash flow is $-9k ($-106k/yr) — negative.
- To cash-flow at today's rent, offer at most $226k (85.0% below list).
- To meet the 1% rule (rent ≥ 1% of price), the offer needs to be $197k (86.8% below list).
- Only 2 days on market — expect competitive offers; lowballing is unlikely to land.
- Recommended offer: $197k (86.8% below list) — sets the bar for 1% rule.
- Local home prices are declining (-3.0%/yr); year-one equity from $10k of loan paydown is wiped out by about $45k of value loss. Plan a longer hold.
- Location reads 66/100 on livability (#598 in TX) — a middle-class / working-renter tenant base. Strengths: cost of living A+, housing A+; Watch: crime F, amenities F, commute F.
- Channelview ISD (suburban): math 27% / reading 30% proficiency, ranked #640 of 826 in TX (top 78%) — low school quality limits family demand, transient renter base, plan for 1-2y turnover; 70% free/reduced lunch — lower-income household profile, screen leases tightly.
- Zoned schools: Channelview H S (math 24% / reading 35%, grade F, #1,112 of 1,632 statewide, top 70%, 2,893 students, 87% FRL) — zoned schools average 87% FRL vs 70% district-wide (17 pts higher); higher-poverty schools than district average — tighter screening recommended.
- Market conditions: Rents rising fast (+16.9%/yr); 100 active listings in the ZIP; 2 comparable units currently listed for rent nearby; 29,883 units permitted in Harris County in 2024 (8,621 in 5+ unit buildings).
- Harris County population projected at +47% by 2050 — long-run rental-demand tailwind backs the buy-and-hold thesis.
- 5 sale attempts since 4y ago with the ask held roughly flat each time — persistent listings suggest the price (not the market) is what's stuck; bring a comps-based counter.
- Cap rate -0.8% vs local median 4.8% in Channelview — below-typical yield; the buyer is paying a premium for something (appreciation thesis, condition, location) that the cap rate doesn't capture.
- This rent runs 38% of the median local income ($62k/yr) — at the standard rent-burdened threshold; future hikes will face affordability resistance.
Questions for listing agent
- What do current leases actually rent for vs. the listed asking? Can we see a recent rent roll and the last 12 months of T-12 income?
- Is there a deadline driving the sale (1031 exchange, divorce, estate, relocation)? That informs how much negotiation room exists.
- Schools are D-rated, which usually means shorter tenancies and higher turnover. Who's the typical renter profile here, and what's been the actual vacancy rate?
- Crime grade is F in this area — have there been break-ins, vandalism, or insurance claims at this property in the last 3 years? What carrier currently insures it and at what premium?
- The area grade is low — what's the realistic commute time and amenity access for the typical tenant pool here? Any planned neighborhood developments (good or bad) we should know about?
- What's the average days-on-market for RENTAL listings here right now (not sales)? A rising rental-DOM trend means longer vacancies and softer asking-rent achievability than the comps imply.
- What's the recent tenant-quality profile in this submarket — average credit score on applications, eviction rate, late-payment / NSF rate, and stable-employment percentage? A property-management company in the area should have these aggregated.
- How much new for-sale + rental construction is in the pipeline within 1–3 miles? Heavy new supply typically softens prices + rents 12–24 months out; constrained supply supports both.
CashFlowRE · CFR-N4R24C7WYT14PC
· Data 2 days ago
cashflowre.app · 2026-05-29