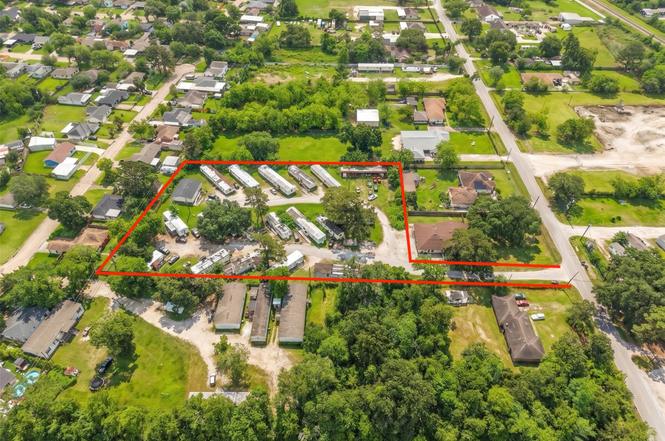
15603 N Brentwood St · Channelview, TX
Flood risk No data
- FEMA flood zone
- —
- Chance of flooding over 30 yrs
- —
- Est. flood insurance / yr
- —
Fire risk No data
- Est. fire insurance / yr
- —
Heat risk No data
- Hot days now (above threshold)
- —
- Hot days in 30 yrs
- —
Wind risk No data
- Chance of severe wind over 30 yrs
- —
Air-quality risk No data
- Unhealthy air days now
- —
- Unhealthy air days in 30 yrs
- —
Risk factors via First Street. Map © Google.
Why this score? — see what drove the F grade
The composite is a weighted blend of 9 inputs, each scored 0–100. Each bar is that input's sub-score; the figure is the points it added to the 100-point composite (weight × sub-score).
- ARV discount +7.5/15.0
- Rent growth +5.0/5.0
- Livability +3.3/5.0
- Schools +2.5/10.0
- Condition / age +2.5/5.0
- Cash flow +0.0/30.0
- 1% rule +0.0/10.0
- DSCR +0.0/10.0
- Appreciation +0.0/10.0
$1,500,000
🖨 Deal sheet (PDF) 📄 Offer letter ✓ Due diligence
Listing remarks
Unique investment opportunity for a fully functional and cash-flowing 18 unit mobile home park. Conveniently located within minutes of I-10 and major employers, this investment property has years of proven income and room for increased rents for new owners.
Key facts
- Mobile home park
- Proven income
- Conveniently located
Tags
Property features AI
Finance
- Other: Seller disclosure available
- Financial info: Multifamily property with 18 total units
Exterior
- Parking: Paved parking
- Utilities: Cable available; Electricity available; Natural gas available; Water available
- Home design: Residential income property
- Construction: Aluminum siding; Vinyl siding; Unknown construction material
- Exterior features: Cleared lot
Interior
- Kitchen: Microwave
- Flooring: Carpet; Tile; Vinyl
- Bathrooms: 2 full bathrooms
- Heating & cooling: Central heating (electric); Central air conditioning (electric)
- Interior features: Window treatments; Window coverings
Neighborhood map
What this means for you Summary
Snapshot
- This is a 3-bed/2.0-bath manufactured listed at $1.50M.
Deal economics
- At list price, monthly cash flow is $-9k ($-106k/yr) — negative.
- To cash-flow at today's rent, offer at most $226k (85.0% below list).
- To meet the 1% rule (rent ≥ 1% of price), the offer needs to be $197k (86.8% below list).
- Recommended offer: $197k (86.8% below list) — sets the bar for 1% rule.
- Cap rate -0.8% vs local median 4.8% in Channelview — below-typical yield; the buyer is paying a premium for something (appreciation thesis, condition, location) that the cap rate doesn't capture.
Location & tenants
- Location reads 66/100 on livability (#598 in TX) — a middle-class / working-renter tenant base. Strengths: cost of living A+, housing A+; Watch: crime F, amenities F, commute F.
- Channelview ISD (suburban): math 27% / reading 30% proficiency, ranked #640 of 826 in TX (top 78%) — low school quality limits family demand, transient renter base, plan for 1-2y turnover; 70% free/reduced lunch — lower-income household profile, screen leases tightly.
- Zoned schools: Channelview H S (math 24% / reading 35%, grade F, #1,112 of 1,632 statewide, top 70%, 2,893 students, 87% FRL) — zoned schools average 87% FRL vs 70% district-wide (17 pts higher); higher-poverty schools than district average — tighter screening recommended.
- Market conditions: Rents rising fast (+16.9%/yr); 100 active listings in the ZIP; 2 comparable units currently listed for rent nearby; 29,883 units permitted in Harris County in 2024 (8,621 in 5+ unit buildings).
- This rent runs 38% of the median local income ($62k/yr) — at the standard rent-burdened threshold; future hikes will face affordability resistance.
Forward outlook
- Local home prices are declining (-3.0%/yr); year-one equity from $10k of loan paydown is wiped out by about $45k of value loss. Plan a longer hold.
- Harris County population projected at +47% by 2050 — long-run rental-demand tailwind backs the buy-and-hold thesis.
Negotiation context
- Only 2 days on market — expect competitive offers; lowballing is unlikely to land.
- 5 sale attempts since 4y ago with the ask held roughly flat each time — persistent listings suggest the price (not the market) is what's stuck; bring a comps-based counter.
Questions for the listing agent
- What do current leases actually rent for vs. the listed asking? Can we see a recent rent roll and the last 12 months of T-12 income?
- Is there a deadline driving the sale (1031 exchange, divorce, estate, relocation)? That informs how much negotiation room exists.
- Schools are D-rated, which usually means shorter tenancies and higher turnover. Who's the typical renter profile here, and what's been the actual vacancy rate?
- Crime grade is F in this area — have there been break-ins, vandalism, or insurance claims at this property in the last 3 years? What carrier currently insures it and at what premium?
- The area grade is low — what's the realistic commute time and amenity access for the typical tenant pool here? Any planned neighborhood developments (good or bad) we should know about?
- What's the average days-on-market for RENTAL listings here right now (not sales)? A rising rental-DOM trend means longer vacancies and softer asking-rent achievability than the comps imply.
- What's the recent tenant-quality profile in this submarket — average credit score on applications, eviction rate, late-payment / NSF rate, and stable-employment percentage? A property-management company in the area should have these aggregated.
- How much new for-sale + rental construction is in the pipeline within 1–3 miles? Heavy new supply typically softens prices + rents 12–24 months out; constrained supply supports both.
Investment metrics
- 1% rule
- 0.13% ✗
- Cap rate
- -0.75%
- Cash-on-cash
- -25.16%
- DSCR
- -0.12
- GRM
- 63.3
CMA / ARV
No comps found within radius.
Projected returns pro-forma
-3.0% appreciation · 8.0% rent growth · sell at horizon
- IRR
- -70.3%
- Equity multiple
- -0.89×
- Total profit
- $-793,543
- Equity at exit
- $223,655
- IRR
- —
- Equity multiple
- -2.25×
- Total profit
- $-1,365,714
- Equity at exit
- $129,693
Cash invested: $420,000 (down + closing). Projections, not guarantees.
Landlord ↔ Tenant lean methodology
- Overall (STATE)
- 87 Strongly Landlord-Friendly
- State Texas
- 87 Strongly Landlord-Friendly · R+5
- County
- — inherits STATE
- City
- — inherits STATE
ZIP-level market 77530
- Rents YoY
- 16.9%
- Active inventory
- 100
- Price-to-rent
- 63.3×
Monthly cashflow live
- Estimated rent
- $1,973 medium interval (Pro) →
- Mortgage (P&I)
- −$7,866
- Tax est. 1.5%
- −$1,875 /mo · $22,500/yr
- Insurance
- −$625
- HOA
- −$0
- Vacancy / Maint / Mgmt
- −$414
- Net cashflow
- $-8,807
Break-even live
Sensitivity live
| Price | -10% $-7,771 | -5% $-8,289 | +0% $-8,807 | +5% $-9,326 | +10% $-9,844 |
|---|---|---|---|---|---|
| Rent | -10% $-8,963 | -5% $-8,885 | +0% $-8,807 | +5% $-8,729 | +10% $-8,651 |
| Rate | -1.0pp $-8,052 | -0.5pp $-8,426 | base $-8,807 | +0.5pp $-9,196 | +1.0pp $-9,591 |
UW: 25.0% down · 7.5% · 30yr · 1.5% tax · 5.0% vac · 8.0% maint · 8.0% mgmt
Financing live
Cash to close
- Down payment
- $375,000
- Closing costs
- $45,000
- Reserves months
- —
- Total cash needed
- —
Loan-product check · same deal, 3 products live
Conventional
25% down · 7.5% · 30yr
- Down + closing
- —
- Monthly P&I
- —
- Monthly cashflow
- —
- DSCR
- —
- Eligible?
- —
Personal DTI + credit; lowest rate.
DSCR
20% down · 8.5% · 30yr
- Down + closing
- —
- Monthly P&I
- —
- Monthly cashflow
- —
- DSCR
- —
- Eligible?
- —
No personal income docs; deal must DSCR.
Hard money
10% down · 12.0% · 12mo
- Down + closing
- —
- Monthly P&I
- —
- Monthly cashflow
- —
- DSCR
- —
- Eligible?
- —
Short-term bridge; refi at stabilization.
Rent comps 2 comps
| Address | Beds | Baths | Sqft | Rent | $/sqft | DOM | Units | Dist |
|---|---|---|---|---|---|---|---|---|
| 15255 Ferness Ln Channelview, TX | 4.0 | 2.0 | 1326 | $1,668 | $1.26 | 3d | 10 | 0.93mi |
| 1379 Dell Dale St Channelview, TX | 4.0 | 2.0 | 1444 | $1,893 | $1.31 | 6d | 1 | 1.21mi |
Listing history 3 events
-
2026-06-18days on market $1,500,000 Active 2 DOM
-
2026-06-17remarks 257-char remark
-
2026-06-17$1,500,000 Active 1 DOM
ⓘ Source: listings_history table (triggers on properties + properties_extension) + one-shot
backfill from property_details.listing_events for pre-trigger history.
Nearby sold comps map
Loading sold comps map…
Walkable amenities ~0.75 mi
Loading nearby amenities…
Taxation est. · year 1
- Rental income
- $23,680
- − Mortgage interest
- −$84,023
- − Property taxes
- −$22,500
- − Insurance
- −$7,500
- − Repairs & maintenance
- −$1,894
- − Management
- −$1,894
- − Depreciation
- −$43,636
- Taxable loss
- −$137,769
- Est. tax savings @ 24.0%
- +$33,064
- After-tax cash flow
- $-72,622/yr
For passive investors: Depreciation is non-cash, so a rental often shows a tax loss while cash-flowing — sheltering income. Rental losses are passive: they offset passive income freely, and up to $25,000/yr can offset ordinary (W-2) income if you actively participate and your MAGI is under $100k (phasing out to $0 by $150k); unused losses carry forward. On sale, claimed depreciation is recaptured at up to 25%, and gains may owe capital-gains tax (a 1031 exchange can defer both). Figures are a year-1 estimate at your 24.0% rate — not tax advice; consult a CPA.
Schools (NCES district)
- District
- Channelview ISD
- NCES district ID
- 4813590
- Math proficiency
- 27% ▼ -22.00%
- Reading proficiency
- 30% ▼ -8.00%
- Median HH income
- $52,320
- Composite
- 25.18/100
- National rank
- #7513
- State rank
- #640 of 826 in TX
Livability — Channelview
- Score
- 66/100
- State rank
- #598
- US rank
- #11392
Category grades
Schools grade is shown separately in the Schools card above.
Census & demographics
- Census place
- Channelview, TX
- County
- Harris County · 4,702,590 people
- City population
- 31,527
- Metro
- Houston-The Woodlands-Sugar Land, TX
- Population (ZIP)
- 31,527
- Household income
- $62,195
- Rent vs Own
- Severe rent burden
- 966.0
Population outlook (Harris County) Hauer SSP2
- Today (2025)
- 5,571,493 people
- By 2030
- 6,089,821 · +9.3%
- By 2040
- 7,142,806 · +28.2%
- By 2050
- 8,185,864 · +46.9%
- By 2075
- 10,574,329 · +89.8%
- By 2100
- 12,109,958 · +117.4%
Race, ethnicity, and origin ACS 2023
- Neighborhood character
- Predominantly Hispanic (71%)
- Race & ethnicity
- Hispanic / Latino 71% Two or more races 31% White 16% Black 9% Asian 4% Native American 1%
- Hispanic origin (detail)
- Mexican 61%
- Common ancestry
- Slovak 1% Lithuanian 1%
- Foreign-born
- 33% · Canada, Vietnam, Jamaica
- Languages at home
- 37% English-only · Spanish 60% Other Asian/Pacific 1% Vietnamese 1%
Political lean MEDSL · Harris
- 2024 margin
- Lean D (+5.5) · D 52.0% · R 46.4% · Other 1.6%
- 2008→2024 swing
- +3.9pp toward D · 2008: 1.6pp · 2024: 5.5pp
- All cycles
- 2024: D+5.5 2020: D+13.3 2016: D+12.4 2012: D+0.1 2008: D+1.6
Not yet ingested
- Civics
- —
Market trends
- HPI YoY
- ▼ -172.05%
- Current HPI
- 292.1862
- Rent YoY
- ▲ 16.85%
- Metro
- Houston-The Woodlands-Sugar Land, TX
- State GDP YoY
- ▲ 3.95%
- F500 in state
- 110
Industry mix (Fortune 500 HQ in TX)
| Industry | F500 HQs | Revenue |
|---|---|---|
| Energy | 16 | $1,198B |
|
||
| Technology | 5 | $198B |
|
||
| Engineering / Construction | 4 | $72B |
|
||
| Energy Services | 3 | $60B |
|
||
| Utilities | 3 | $41B |
|
||
| Healthcare | 2 | $330B |
|
||
Price history
+525.0% since first listed13 events — show timeline
- 2026-06-16 Listed $1,500,000 HARMLS
- 2025-12-31 Listing Removed — HARMLS
- 2025-10-06 Price Changed $2,635,000 HARMLS
- 2025-07-01 Price Changed $2,665,000 HARMLS
- 2025-05-30 Price Changed $2,700,000 HARMLS
- 2025-05-30 Listed $27,000,000 HARMLS
- 2022-06-15 Listing Removed — HARMLS
- 2022-06-11 Listed $199,999 HARMLS
- 2022-06-09 Listing Removed — HARMLS
- 2022-05-10 Relisted — HARMLS
- 2022-05-04 Pending — HARMLS
- 2022-04-12 Price Changed $220,000 HARMLS
- 2022-03-17 Listed $240,000 HARMLS
Property tax history
-1.9%/yrLatest (2025): $119 · -1.2% YoY. Source: county tax records.
Cash-flow waterfall
monthlySold comps — $/sqft
last 12 mo · ≤1 miLoading sold comps…