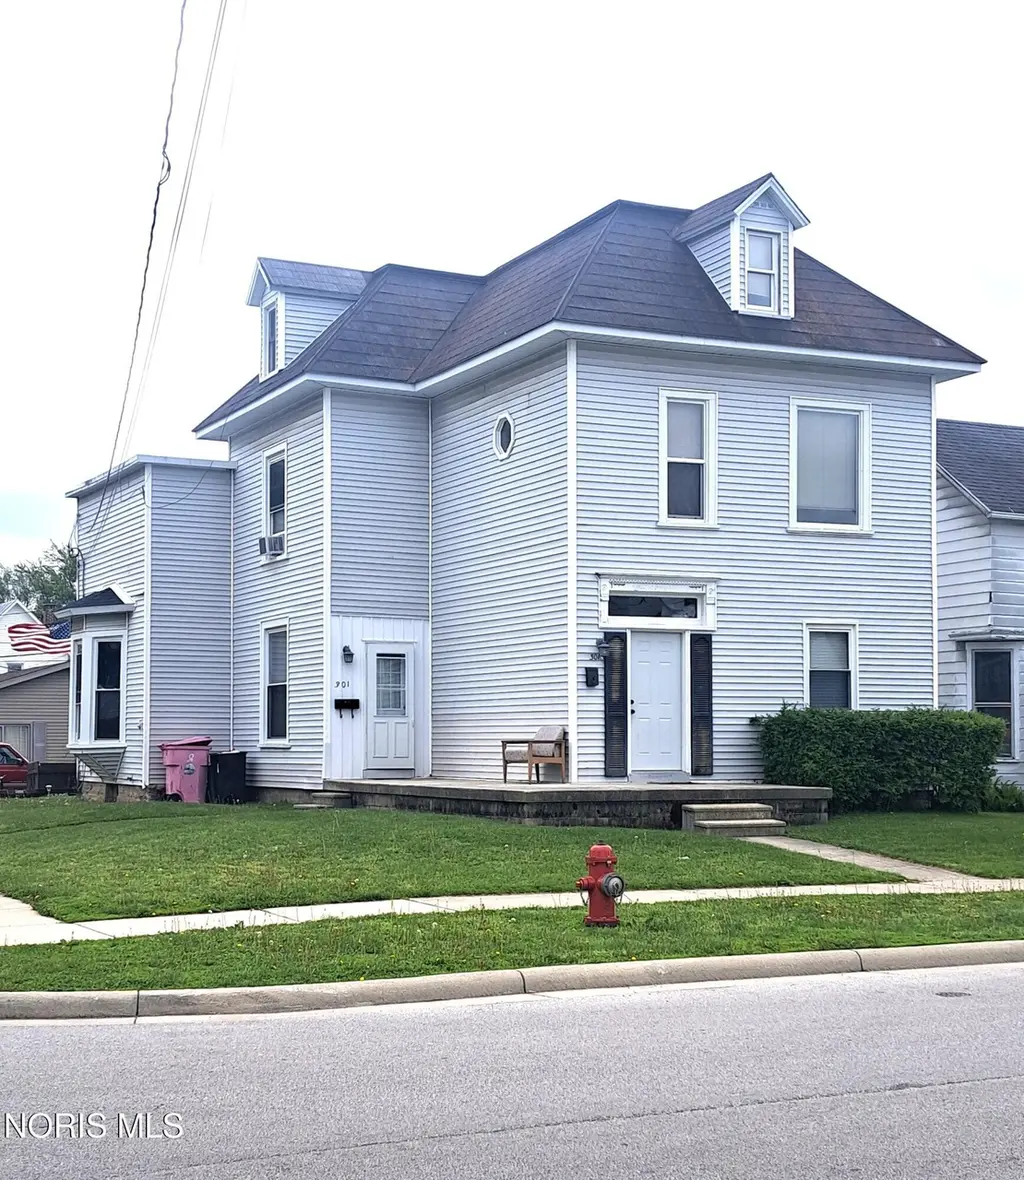
301 Howard St
Findlay, OH 45840
$189,000B
3 bd · 3.0 ba ·
2,212 sqft ·
Built 1900
· MultiFamily
· Pending
· 15 DOM
Cashflow @ list (25.0% down · 7.5%)
Estimated rent
$4,468/mo
Mortgage (P&I)
−$991
Tax + insurance
−$221
HOA
−$0
Vac / Maint / Mgmt
−$938
Net cashflow
$2,317/mo
Annual
$27,809/yr
Cap rate
21.01%
Cash-on-cash
52.55%
DSCR
3.34
1% rule
2.36%
Cash to close
$52,920
Investor read
- This is a 3 × 3-bed/3.0-bath units multifamily listed at $189k.
- At list price, monthly cash flow is $2k ($28k/yr) — positive. Per door: $772/mo.
- The deal already cash-flows at list — no discount required.
- Meets the 1% rule at list price ($4k rent vs $189k).
- It's been on market 15 days — a 2% lower offer ($186k) is reasonable based on typical stale-listing flexibility.
- Recommended offer: $186k (1.5% below list) — sets the bar for market timing.
- Local home prices are declining (-3.0%/yr); year-one equity from $1k of loan paydown is wiped out by about $6k of value loss. Plan a longer hold.
- Location reads 81/100 on livability (#98 in OH, #1,496 nationally) — a professional / high-income tenant draw. Strengths: amenities A+, cost of living A+, housing A+; Watch: employment D+, commute F.
- Findlay City (town): math 56% / reading 56% proficiency, ranked #357 of 656 in OH (top 54%) — acceptable for families but not a draw, mixed tenant base, ~2y average lease.
- Zoned schools: Northview Primary School (math 57% / reading 57%, grade C+, #729 of 1,584 statewide, top 48%, 361 students, 54% FRL); Donnell Middle School (math 57% / reading 54%, grade B-, #321 of 654 statewide, top 51%, 523 students, 41% FRL); Findlay High School (math 51% / reading 60%, grade C, #296 of 781 statewide, top 39%, 1,915 students, 31% FRL) — zoned schools at 42% FRL track the district average.
- Watch-outs: built in 1900 — expect roof / HVAC / electrical / plumbing capex.
- Market conditions: Rents rising fast (+5.7%/yr); 219 active listings in the ZIP; 257 units permitted in Hancock County in 2024 (150 in 5+ unit buildings).
- Hancock County population projected to shrink 4% by 2050 — rents likely to lag national; underwrite the cash flow, not the appreciation.
- At projected returns (-3.0% appreciation + 5.7% rent growth), your $53k cash investment doubles in ~3 years — after that, you're playing with house money.
- Cap rate 21.0% vs local median 5.0% in Findlay — top-decile yield for the area; either an underpriced asset or a hidden risk that comps aren't pricing in. Stress-test before assuming the spread holds.
- At $4,468/mo this rent would consume 79% of the median local household income ($68k/yr) (locally 1540% of renters already pay >50% of income on rent) — very limited rent-growth headroom before tenants either downsize or default.
Questions for listing agent
- Can we see the unit-by-unit rent roll, current vacancy, and any below-market leases? What's the average tenancy length?
- What capital expenditures (roof, boiler, parking lot, exteriors) have been made in the last 5 years, and what's planned in the next 2?
- Built in 1900 — when were the roof, HVAC, electrical panel, plumbing, and water heater last replaced?
- Is there a deadline driving the sale (1031 exchange, divorce, estate, relocation)? That informs how much negotiation room exists.
- Schools are B-rated — typically a magnet for longer-tenancy family renters. What's the average tenant stay here, and is there a school-zone premium baked into asking?
- What's the average days-on-market for RENTAL listings here right now (not sales)? A rising rental-DOM trend means longer vacancies and softer asking-rent achievability than the comps imply.
- What's the recent tenant-quality profile in this submarket — average credit score on applications, eviction rate, late-payment / NSF rate, and stable-employment percentage? A property-management company in the area should have these aggregated.
- How much new apartment / multifamily construction is in the pipeline within 1–3 miles? Heavy new supply (>2% of stock underway) typically softens rents 12–24 months out; light construction supports rent growth.
CashFlowRE · CFR-N4XF6C85ARM7Y0
· Data 3 weeks ago
cashflowre.app · 2026-05-29