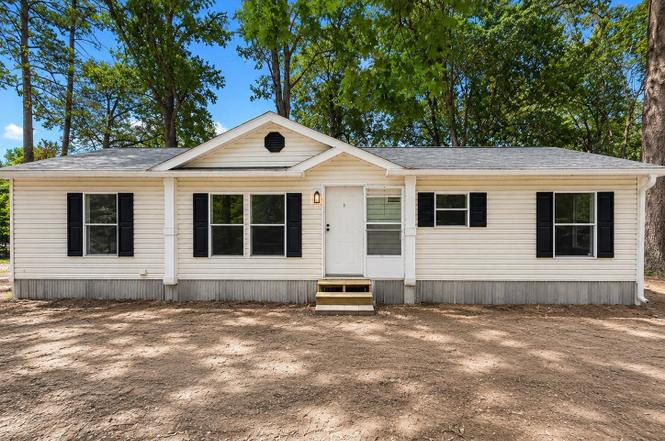
454 Elderville Peatown Rd
Lakeport, TX 75603
$149,900C-
3 bd · 2.0 ba ·
1,848 sqft ·
Built 2008
· Manufactured
· Active
· 8 DOM
Cashflow @ list (25.0% down · 7.5%)
Estimated rent
$1,280/mo
Mortgage (P&I)
−$786
Tax + insurance
−$140
HOA
−$0
Vac / Maint / Mgmt
−$269
Net cashflow
$85/mo
Annual
$1,020/yr
Cap rate
6.97%
Cash-on-cash
2.43%
DSCR
1.11
1% rule
0.85%
Cash to close
$41,972
Investor read
- This is a 3-bed/2.0-bath manufactured listed at $150k.
- At list price, monthly cash flow is $85 ($1k/yr) — positive.
- The deal already cash-flows at list — no discount required.
- To meet the 1% rule (rent ≥ 1% of price), the offer needs to be $128k (14.6% below list).
- Only 8 days on market — expect competitive offers; lowballing is unlikely to land.
- Recommended offer: $128k (14.6% below list) — sets the bar for 1% rule.
- In year one you build about $16k of equity ($1k loan paydown + $15k appreciation (10.0% local appreciation)).
- Location reads 69/100 on livability (#406 in TX) — a middle-class / working-renter tenant base. Strengths: crime A+, cost of living A+, housing A+; Watch: amenities F, commute F, health & safety D-.
- Longview ISD (urban): math 49% / reading 46% proficiency, ranked #244 of 826 in TX (top 30%) — families likely to look elsewhere, expect single-tenant / working-renter base with shorter leases; 66% free/reduced lunch — lower-income household profile, screen leases tightly.
- Zoned schools: Ned E Williams El (math 41% / reading 35%, grade F, #1,709 of 4,322 statewide, top 40%, 377 students, 93% FRL, charter); Foster Middle (math 46% / reading 52%, grade C-, #378 of 1,662 statewide, top 23%, 809 students, 84% FRL, charter); Longview H S (math 61% / reading 52%, grade C, #357 of 1,632 statewide, top 22%, 2,170 students, 82% FRL, charter) — zoned schools average 86% FRL vs 66% district-wide (20 pts higher); higher-poverty schools than district average — tighter screening recommended.
- Market conditions: 45 active listings in the ZIP; 193 units permitted in Gregg County in 2024 (0 in 5+ unit buildings).
- 2 sale attempts with the ask held roughly flat each time — persistent listings suggest the price (not the market) is what's stuck; bring a comps-based counter.
- At projected returns (10.0% appreciation + 3.0% rent growth), your $42k cash investment doubles in ~3 years — after that, you're playing with house money.
- By year 3, paydown + projected appreciation supports a ~$41k cash-out refi (75% LTV) — recoverable capital for the next deal without selling this one.
- Climate carrying-cost: major wind risk, 53% chance of damaging wind over 30y; major wildfire risk; extreme-heat days projected 7→24/yr by 2055 (HVAC capex compounding) — expect insurance premiums to compound above CPI over the hold.
Questions for listing agent
- Is there a deadline driving the sale (1031 exchange, divorce, estate, relocation)? That informs how much negotiation room exists.
- Schools are F-rated, which usually means shorter tenancies and higher turnover. Who's the typical renter profile here, and what's been the actual vacancy rate?
- What's the average days-on-market for RENTAL listings here right now (not sales)? A rising rental-DOM trend means longer vacancies and softer asking-rent achievability than the comps imply.
- What's the recent tenant-quality profile in this submarket — average credit score on applications, eviction rate, late-payment / NSF rate, and stable-employment percentage? A property-management company in the area should have these aggregated.
- How much new for-sale + rental construction is in the pipeline within 1–3 miles? Heavy new supply typically softens prices + rents 12–24 months out; constrained supply supports both.
CashFlowRE · CFR-N69P20DRPN3J8F
· Data 1 day ago
cashflowre.app · 2026-05-29