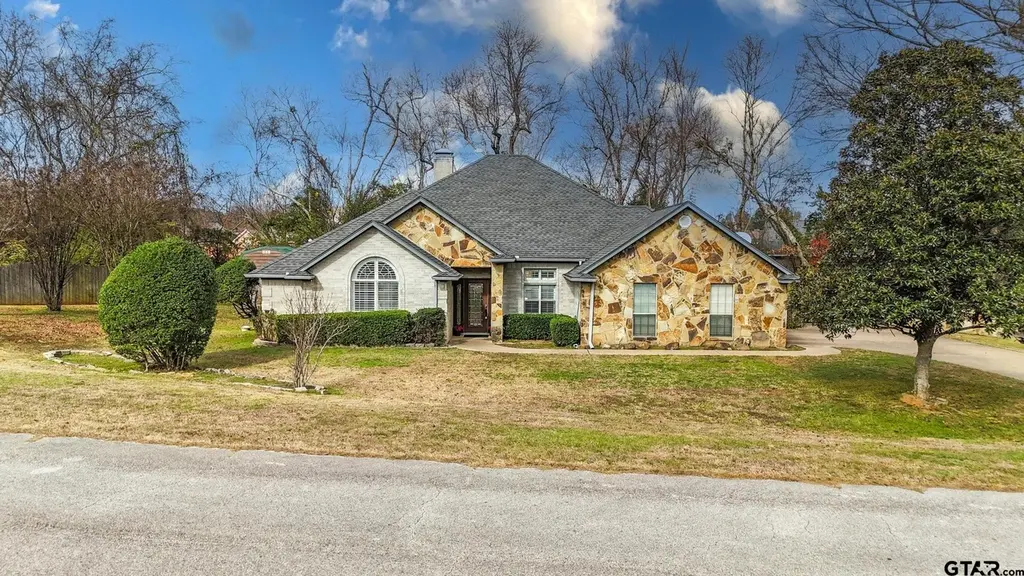
15360 Wagon Wheel Dr
Chandler, TX 75758
$349,000C-
3 bd · 2.0 ba ·
2,267 sqft ·
Built 2003
· SingleFamily
· Active
· 17 DOM
Cashflow @ list (25.0% down · 7.5%)
Estimated rent
$3,495/mo
Mortgage (P&I)
−$1,830
Tax + insurance
−$805
HOA
−$0
Vac / Maint / Mgmt
−$734
Net cashflow
$126/mo
Annual
$1,510/yr
Cap rate
6.95%
Cash-on-cash
2.36%
DSCR
1.11
1% rule
1.00%
Cash to close
$97,720
Investor read
- This is a 3-bed/2.0-bath single-family listed at $349k.
- At list price, monthly cash flow is $126 ($2k/yr) — positive.
- The deal already cash-flows at list — no discount required.
- Meets the 1% rule at list price ($3k rent vs $349k).
- It's been on market 17 days — a 2% lower offer ($344k) is reasonable based on typical stale-listing flexibility.
- Recommended offer: $344k (1.5% below list) — sets the bar for market timing.
- Local home prices are declining (-3.0%/yr); year-one equity from $2k of loan paydown is wiped out by about $10k of value loss. Plan a longer hold.
- Location reads 70/100 on livability (#347 in TX) — a middle-class / working-renter tenant base. Strengths: crime A+, cost of living A+, housing A+; Watch: amenities F, commute F, employment D-.
- Brownsboro ISD (rural): math 42% / reading 46% proficiency, ranked #290 of 826 in TX (top 35%) — families likely to look elsewhere, expect single-tenant / working-renter base with shorter leases.
- Zoned schools: Chandler El (math 42% / reading 37%, grade F, #1,545 of 4,322 statewide, top 38%, 450 students, 74% FRL); Chandler Int (math 39% / reading 35%, grade F, #756 of 1,662 statewide, top 47%, 253 students, 70% FRL); Brownsboro H S (math 31% / reading 63%, grade D-, #591 of 1,632 statewide, top 38%, 757 students, 50% FRL).
- Watch-outs: flood insurance adds $66/mo.
- Market conditions: 225 active listings in the ZIP; 1 comparable units currently listed for rent nearby; 263 units permitted in Henderson County in 2024 (0 in 5+ unit buildings).
- 4 sale attempts since 10y ago with the ask held roughly flat each time — persistent listings suggest the price (not the market) is what's stuck; bring a comps-based counter.
- Current owner paid $175k; list at $349k implies a 99% gain — meaningful room to come down on a strong offer.
- Climate carrying-cost: severe flood risk; major wind risk, 61% chance of damaging wind over 30y; extreme-heat days projected 7→26/yr by 2055 (HVAC capex compounding) — expect insurance premiums to compound above CPI over the hold.
- Cap rate 7.0% vs local median 3.8% in Chandler — top-decile yield for the area; either an underpriced asset or a hidden risk that comps aren't pricing in. Stress-test before assuming the spread holds.
Questions for listing agent
- What's the actual annual flood-insurance premium (NFIP or private), and is the property in a SFHA with mandatory coverage?
- Is there a deadline driving the sale (1031 exchange, divorce, estate, relocation)? That informs how much negotiation room exists.
- Schools are D-rated, which usually means shorter tenancies and higher turnover. Who's the typical renter profile here, and what's been the actual vacancy rate?
- What's the average days-on-market for RENTAL listings here right now (not sales)? A rising rental-DOM trend means longer vacancies and softer asking-rent achievability than the comps imply.
- What's the recent tenant-quality profile in this submarket — average credit score on applications, eviction rate, late-payment / NSF rate, and stable-employment percentage? A property-management company in the area should have these aggregated.
- How much new for-sale + rental construction is in the pipeline within 1–3 miles? Heavy new supply typically softens prices + rents 12–24 months out; constrained supply supports both.
CashFlowRE · CFR-N8WKSHFWZNEX43
· Data 1 day ago
cashflowre.app · 2026-05-29