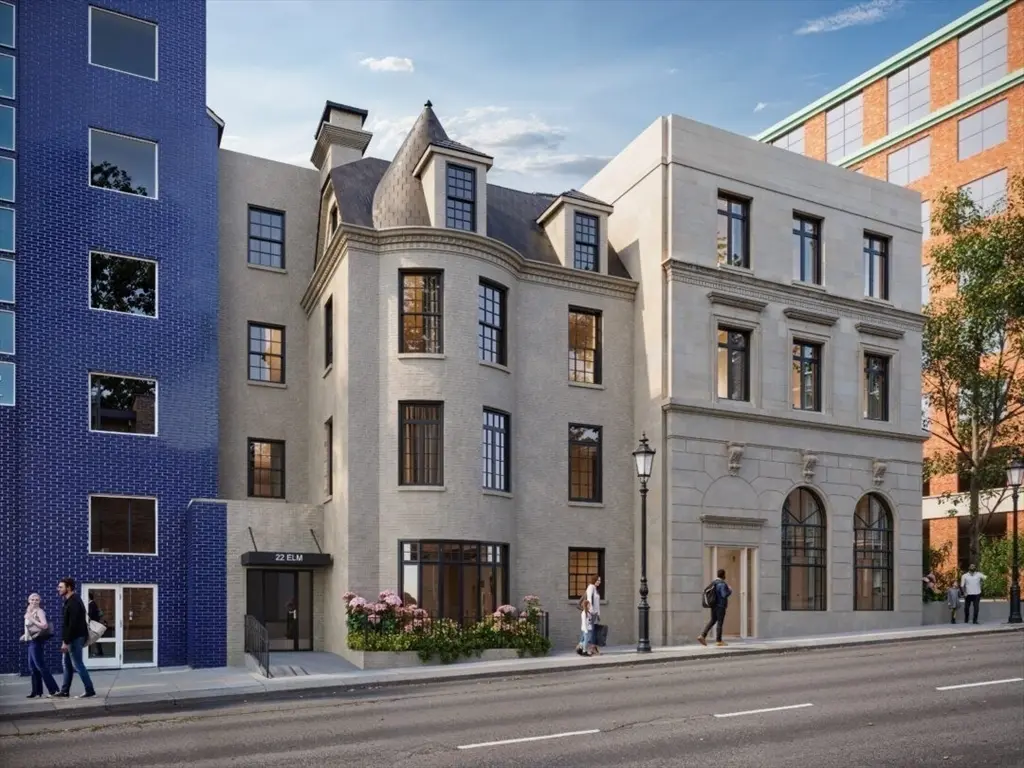
22 Elm St #401
Worcester, MA 01608
$235,500C-
2 bd · 2.0 ba ·
1,467 sqft ·
Built 2026
· Condo
· Active
· 37 DOM
Cashflow @ list (25.0% down · 7.5%)
Estimated rent
$2,331/mo
Mortgage (P&I)
−$1,235
Tax + insurance
−$392
HOA
−$353
Vac / Maint / Mgmt
−$490
Net cashflow
$-139/mo
Annual
$-1,667/yr
Cap rate
5.59%
Cash-on-cash
-2.53%
DSCR
0.89
1% rule
0.99%
Cash to close
$65,940
Investor read
- This is a 2-bed/2.0-bath condo listed at $236k. Condition is rated excellent.
- At list price, monthly cash flow is $-139 ($-2k/yr) — negative.
- To cash-flow at today's rent, offer at most $215k (8.5% below list).
- To meet the 1% rule (rent ≥ 1% of price), the offer needs to be $233k (1.0% below list).
- It's been on market 37 days — a 3% lower offer ($228k) is reasonable based on typical stale-listing flexibility.
- Recommended offer: $215k (8.5% below list) — sets the bar for cash-flow.
- In year one you build about $7k of equity ($2k loan paydown + $5k appreciation (2.3% local appreciation)).
- Location reads 87/100 on livability (#9 in MA, #312 nationally) — a professional / high-income tenant draw. Strengths: crime A+, amenities A+, commute A+; Watch: schools C-, cost of living D.
- Worcester (urban): math 17% / reading 30% proficiency, ranked #280 of 302 in MA (top 93%) — low school quality limits family demand, transient renter base, plan for 1-2y turnover; 66% free/reduced lunch — lower-income household profile, screen leases tightly.
- Market conditions: Rents rising fast (+7.8%/yr); 9 active listings in the ZIP; 40 comparable units currently listed for rent nearby; rentals at typical pace (median 24d on market — plan ~3-4 weeks tenant-placement turnaround); 42% of comp listings sitting > 30 days — soft ceiling on asking rent; 2,293 units permitted in Worcester County in 2024 (1,205 in 5+ unit buildings).
- By year 5, paydown + projected appreciation supports a ~$31k cash-out refi (75% LTV) — recoverable capital for the next deal without selling this one.
- Cap rate 5.6% vs local median 4.1% in Worcester — top-decile yield for the area; either an underpriced asset or a hidden risk that comps aren't pricing in. Stress-test before assuming the spread holds.
- At $2,331/mo this rent would consume 61% of the median local household income ($46k/yr) (locally 623% of renters already pay >50% of income on rent) — very limited rent-growth headroom before tenants either downsize or default.
Questions for listing agent
- What do current leases actually rent for vs. the listed asking? Can we see a recent rent roll and the last 12 months of T-12 income?
- It's been on market 37 days. Have you received any prior offers? Is the seller open to a 9% concession, seller financing, or rate buy-down credit?
- What does the HOA fee cover, when was the last increase, and are there any pending special assessments or reserve-fund shortfalls?
- Any open or pending special assessments — roof, HVAC, plumbing, elevator, façade? What's the per-unit balance and payoff schedule, and is the seller paying it off at close or rolling it to the buyer?
- Is there a deadline driving the sale (1031 exchange, divorce, estate, relocation)? That informs how much negotiation room exists.
- What's the average days-on-market for RENTAL listings here right now (not sales)? A rising rental-DOM trend means longer vacancies and softer asking-rent achievability than the comps imply.
- What's the recent tenant-quality profile in this submarket — average credit score on applications, eviction rate, late-payment / NSF rate, and stable-employment percentage? A property-management company in the area should have these aggregated.
- How much new apartment / multifamily construction is in the pipeline within 1–3 miles? Heavy new supply (>2% of stock underway) typically softens rents 12–24 months out; light construction supports rent growth.
CashFlowRE · CFR-N9AHY45VG7ME5N
· Data 2 days ago
cashflowre.app · 2026-05-29