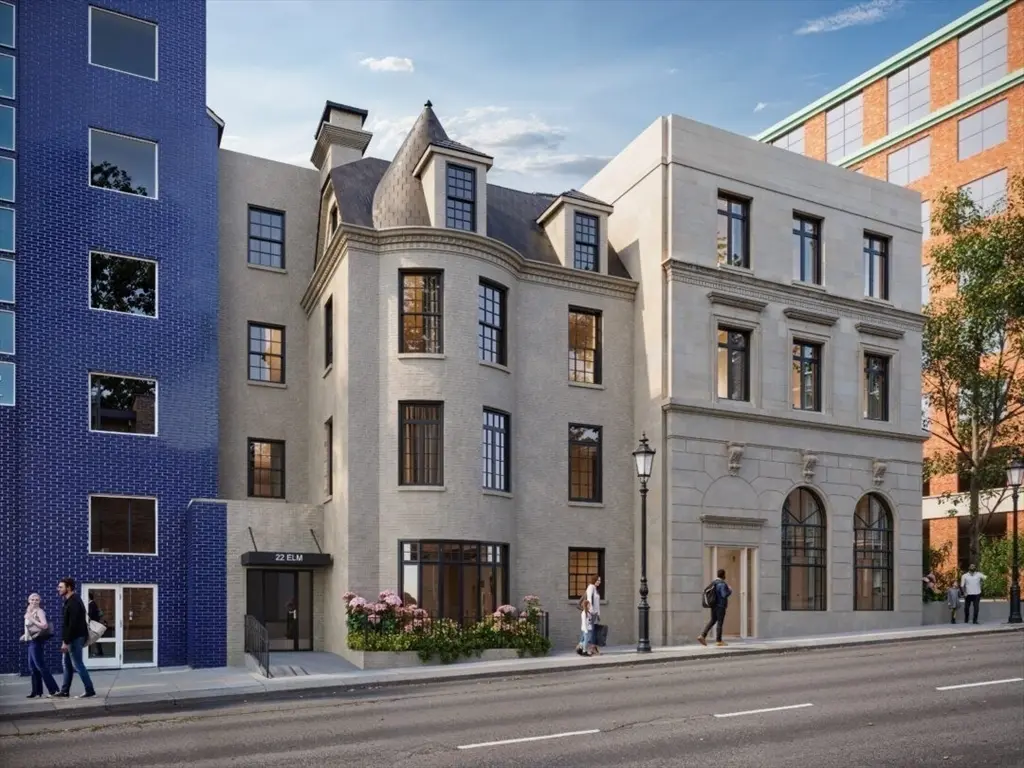
22 Elm St #401 · Worcester, MA
Flood risk No data
- FEMA flood zone
- —
- Chance of flooding over 30 yrs
- —
- Est. flood insurance / yr
- —
Fire risk No data
- Est. fire insurance / yr
- —
Heat risk 4/10 · Minor
- Hot days now (above threshold)
- 7 days/yr
- Hot days in 30 yrs
- 16 days/yr
Wind risk No data
- Chance of severe wind over 30 yrs
- —
Air-quality risk 2/10 · Minimal
- Unhealthy air days now
- 1 days/yr
- Unhealthy air days in 30 yrs
- 2 days/yr
Risk factors via First Street. Map © Google.
Why this score? — see what drove the C- grade
The composite is a weighted blend of 9 inputs, each scored 0–100. Each bar is that input's sub-score; the figure is the points it added to the 100-point composite (weight × sub-score).
- ARV discount +15.0/15.0
- Cash flow +10.1/30.0
- Appreciation +6.1/10.0
- 1% rule +4.9/10.0
- Condition / age +4.8/5.0
- Rent growth +4.5/5.0
- Livability +4.4/5.0
- DSCR +2.9/10.0
- Schools +2.0/10.0
$235,500
🖨 Deal sheet 📄 Offer letter ✓ Due diligence
Listing remarks
22 Elm is a residential development in Worcester consisting of 22 units. All 22 units will be sold to households earning at or below 80% AMI (Area Median Income) for the Worcester, MA HUD Metro FMR Area. 1HH $69,850, 2HH $79,800, 3HH $89,800, Asset Limit: $155,000. This exciting new condominium development in the heart of downtown is housed in a beautifully reimagined historic building. 22 brand-new condominiums including one, two, and three bedroom units and offers first-time homebuyers a rare opportunity to put down roots in this vibrant urban core. Residents enjoy premium amenities including an on-site elevator, included storage lockers, bike storage, a fitness center, and a community ro
Key facts
- Fitness center
- Premium amenities
- Historic building
Tags
Property features AI
Finance
- Other: Not a senior community
- HOA & community: Monthly association fee of $353.12; HOA covers insurance, structure maintenance, grounds maintenance, snow removal, and reserve funds; Building amenities include elevator(s) and storage
Exterior
- Parking: Off-street parking (rented)
- Utilities: Public water; Public sewer
- Home design: Condominium (attached); Mid-rise building; Entry on level 4; Under construction (builder provided year built)
- Construction: 1 story; Approximately 1,467 total building area
Interior
- Bathrooms: 2 full bathrooms
- Heating & cooling: Central heating; Central air conditioning
- Interior features: Total of 3 rooms
Neighborhood map
What this means for you Summary
Snapshot
- This is a 2-bed/2.0-bath condo listed at $236k. Condition is rated excellent.
Deal economics
- At list price, monthly cash flow is $-139 ($-2k/yr) — negative.
- To cash-flow at today's rent, offer at most $215k (8.5% below list).
- To meet the 1% rule (rent ≥ 1% of price), the offer needs to be $233k (1.0% below list).
- Recommended offer: $215k (8.5% below list) — sets the bar for cash-flow.
- Cap rate 5.6% vs local median 4.1% in Worcester — top-decile yield for the area; either an underpriced asset or a hidden risk that comps aren't pricing in. Stress-test before assuming the spread holds.
Location & tenants
- Location reads 87/100 on livability (#9 in MA, #312 nationally) — a professional / high-income tenant draw. Strengths: crime A+, amenities A+, commute A+; Watch: schools C-, cost of living D.
- Worcester (urban): math 17% / reading 30% proficiency, ranked #280 of 302 in MA (top 93%) — low school quality limits family demand, transient renter base, plan for 1-2y turnover; 66% free/reduced lunch — lower-income household profile, screen leases tightly.
- Market conditions: Rents rising fast (+7.8%/yr); 9 active listings in the ZIP; 40 comparable units currently listed for rent nearby; rentals at typical pace (median 24d on market — plan ~3-4 weeks tenant-placement turnaround); 42% of comp listings sitting > 30 days — soft ceiling on asking rent; 2,293 units permitted in Worcester County in 2024 (1,205 in 5+ unit buildings).
- At $2,331/mo this rent would consume 61% of the median local household income ($46k/yr) (locally 623% of renters already pay >50% of income on rent) — very limited rent-growth headroom before tenants either downsize or default.
Forward outlook
- In year one you build about $7k of equity ($2k loan paydown + $5k appreciation (2.3% local appreciation)).
- By year 5, paydown + projected appreciation supports a ~$31k cash-out refi (75% LTV) — recoverable capital for the next deal without selling this one.
Negotiation context
- It's been on market 37 days — a 3% lower offer ($228k) is reasonable based on typical stale-listing flexibility.
Questions for the listing agent
- What do current leases actually rent for vs. the listed asking? Can we see a recent rent roll and the last 12 months of T-12 income?
- It's been on market 37 days. Have you received any prior offers? Is the seller open to a 9% concession, seller financing, or rate buy-down credit?
- What does the HOA fee cover, when was the last increase, and are there any pending special assessments or reserve-fund shortfalls?
- Any open or pending special assessments — roof, HVAC, plumbing, elevator, façade? What's the per-unit balance and payoff schedule, and is the seller paying it off at close or rolling it to the buyer?
- Is there a deadline driving the sale (1031 exchange, divorce, estate, relocation)? That informs how much negotiation room exists.
- What's the average days-on-market for RENTAL listings here right now (not sales)? A rising rental-DOM trend means longer vacancies and softer asking-rent achievability than the comps imply.
- What's the recent tenant-quality profile in this submarket — average credit score on applications, eviction rate, late-payment / NSF rate, and stable-employment percentage? A property-management company in the area should have these aggregated.
- How much new apartment / multifamily construction is in the pipeline within 1–3 miles? Heavy new supply (>2% of stock underway) typically softens rents 12–24 months out; light construction supports rent growth.
Investment metrics
- 1% rule
- 0.99% ✗
- Cap rate
- 5.59%
- Cash-on-cash
- -2.53%
- DSCR
- 0.89
- GRM
- 8.4
CMA / ARV
- ARV (median comp)
- $288,754
- List price
- $235,500
- Delta
- -18.44%
- Verdict
- UNDERPRICED
- Comps
- 20 within 1.0 mi
Projected returns pro-forma
2.29% appreciation · 7.8% rent growth · sell at horizon
- IRR
- 6.1%
- Equity multiple
- 1.35×
- Total profit
- $22,907
- Equity at exit
- $96,666
- IRR
- 12.4%
- Equity multiple
- 2.93×
- Total profit
- $127,187
- Equity at exit
- $142,163
Cash invested: $65,940 (down + closing). Projections, not guarantees.
Landlord ↔ Tenant lean methodology
- Overall (STATE)
- 20 Strongly Tenant-Friendly
- State Massachusetts
- 20 Strongly Tenant-Friendly · D+15
- County
- — inherits STATE
- City
- — inherits STATE
ZIP-level market 01608
- Home prices YoY
- 0.7%
- Rents YoY
- 7.8%
- Active inventory
- 9
- Price-to-rent
- 8.4×
Monthly cashflow live
- Estimated rent
- $2,331 high interval (Pro) →
- Mortgage (P&I)
- −$1,235
- Tax est. 1.5%
- −$294 /mo · $3,532/yr
- Insurance
- −$98
- HOA
- −$353
- Vacancy / Maint / Mgmt
- −$490
- Net cashflow
- $-139
Break-even live
UW: 25.0% down · 7.5% · 30yr · 1.5% tax · 5.0% vac · 8.0% maint · 8.0% mgmt
Financing live
Cash to close
- Down payment
- $58,875
- Closing costs
- $7,065
- Reserves months
- —
- Total cash needed
- —
Loan-product check · same deal, 3 products live
Conventional
25% down · 7.5% · 30yr
- Down + closing
- —
- Monthly P&I
- —
- Monthly cashflow
- —
- DSCR
- —
- Eligible?
- —
Personal DTI + credit; lowest rate.
DSCR
20% down · 8.5% · 30yr
- Down + closing
- —
- Monthly P&I
- —
- Monthly cashflow
- —
- DSCR
- —
- Eligible?
- —
No personal income docs; deal must DSCR.
Hard money
10% down · 12.0% · 12mo
- Down + closing
- —
- Monthly P&I
- —
- Monthly cashflow
- —
- DSCR
- —
- Eligible?
- —
Short-term bridge; refi at stabilization.
Rent comps 40 comps
| Address | Beds | Baths | Sqft | Rent | $/sqft | DOM | Units | Dist |
|---|---|---|---|---|---|---|---|---|
| 16 Norwich St Unit 1 Worcester, MA | 2.0 | 2.0 | 1280 | $2,275 | $1.78 | 23d | 1 | 0.17mi |
| 6 Chatham St Worcester, MA | 2.0 | 1.0–2.0 | 943 | $3,700 | $3.92 | 43d | 3 | 0.21mi |
| 36 Cedar St Unit 2A Worcester, MA | 2.0 | 2.0 | 1500 | $2,300 | $1.53 | 23d | 1 | 0.25mi |
| 36 Cedar St Unit 2 Worcester, MA | 2.0 | 2.0 | 1500 | $2,650 | $1.77 | 43d | 1 | 0.25mi |
| 50 Franklin St Worcester, MA | 3.0 | 1.0 | 690 | $2,117 | $3.07 | 14d | 29 | 0.29mi |
| 10 Cottage St Unit 1 Worcester, MA | 3.0 | 1.0 | 1250 | $2,500 | $2.00 | 43d | 1 | 0.32mi |
| 230 Pleasant St Unit 2 Worcester, MA | 3.0 | 1.0 | 1600 | $2,150 | $1.34 | 43d | 1 | 0.32mi |
| 600 Main St Worcester, MA | 1.0–2.0 | 1.0 | 766 | $1,951 | $2.55 | 14d | 17 | 0.33mi |
| 17 Wachusett St Unit 3 Worcester, MA | 3.0 | 1.0 | 1120 | $2,150 | $1.92 | 23d | 1 | 0.34mi |
| 17 Congress St Unit 2 Worcester, MA | 3.0 | 1.0 | 1100 | $1,849 | $1.68 | 14d | 1 | 0.37mi |
| 23 Lancaster St Worcester, MA | 3.0 | 1.5 | 1768 | $2,800 | $1.58 | 14d | 1 | 0.39mi |
| 145 Front St Worcester, MA | 2.0 | 1.0–2.0 | 785 | $3,156 | $4.02 | 14d | 15 | 0.41mi |
| 2 Main St Worcester, MA | 3.0 | 1.0–2.5 | 2046 | $3,531 | $1.73 | 23d | 6 | 0.43mi |
| 5 Madison St Worcester, MA | 2.0 | 1.0–2.0 | 811 | $3,720 | $4.59 | 23d | 1 | 0.43mi |
| 1 Pelham St Unit B Worcester, MA | 3.0 | 3.0 | 1656 | $2,895 | $1.75 | 43d | 1 | 0.50mi |
| 21 Sycamore St Unit 7 Worcester, MA | 3.0 | 1.0 | 875 | $1,725 | $1.97 | 43d | 1 | 0.53mi |
| 36 Roxbury St Unit 1 Worcester, MA | 3.0 | 1.5 | 1100 | $2,450 | $2.23 | 19d | 1 | 0.53mi |
| 70 Russell St Apt 6 Worcester, MA | 3.0 | 1.0 | 950 | $2,300 | $2.42 | 23d | 1 | 0.55mi |
| 24 Somerset St Unit 2 Worcester, MA | 2.0 | 1.0 | 1440 | $1,900 | $1.32 | 43d | 1 | 0.56mi |
| 85 Green St Worcester, MA | 2.0 | 1.0–2.0 | 719 | $4,400 | $6.12 | 14d | 22 | 0.57mi |
| 17 Hermon St Worcester, MA | 2.0 | 1.0–2.0 | 752 | $2,800 | $3.72 | 21d | 11 | 0.57mi |
| 22 Mount Carmel Way Worcester, MA | 1.0–3.0 | 1.0–2.0 | 1000 | $2,826 | $2.83 | 14d | 31 | 0.58mi |
| 8 Grafton St Worcester, MA | 2.0 | 1.0–2.5 | 955 | $3,350 | $3.51 | 14d | 46 | 0.59mi |
| 47 Piedmont St #2 Worcester, MA | 3.0 | 1.0 | 1300 | $2,100 | $1.62 | 43d | 1 | 0.60mi |
| 47 Piedmont St Unit 1 Worcester, MA | 3.0 | 1.0 | 1300 | $2,200 | $1.69 | 43d | 1 | 0.60mi |
| 136 Russell St Unit 1A Worcester, MA | 1.0 | 1.0 | 1061 | $2,650 | $2.50 | 43d | 1 | 0.61mi |
| 21 Salisbury St Worcester, MA | 1.0–3.0 | 1.0–2.0 | 935 | $3,194 | $3.41 | 43d | 1 | 0.61mi |
| 23 Bellevue St Apt 1 Worcester, MA | 3.0 | 1.0 | 1100 | $2,400 | $2.18 | 23d | 1 | 0.65mi |
| 23 Bellevue St Unit 2 Worcester, MA | 3.0 | 1.0 | 1100 | $2,450 | $2.23 | 23d | 1 | 0.65mi |
| 27 Shelby St Apt 3 Worcester, MA | 2.0 | 1.0 | 1000 | $2,000 | $2.00 | 43d | 1 | 0.66mi |
| 27 Shelby St Apt 1 Worcester, MA | 3.0 | 1.0 | 1400 | $2,500 | $1.79 | 21d | 1 | 0.66mi |
| 1 Green Island Blvd Worcester, MA | 3.0 | 1.0–2.0 | 904 | $3,112 | $3.44 | 14d | 27 | 0.67mi |
| 80 Salisbury St #806 Worcester, MA | 2.0 | 2.0 | 1064 | $2,750 | $2.58 | 43d | 1 | 0.68mi |
| 48 Water St #418 Worcester, MA | 1.0 | 2.0 | 1300 | $2,500 | $1.92 | 23d | 1 | 0.68mi |
| 30 Elliot St Unit 3 Worcester, MA | 3.0 | 1.0 | 1478 | $2,000 | $1.35 | 23d | 1 | 0.69mi |
| 62 Elliot St Unit 2 Worcester, MA | 2.0 | 1.0 | 1038 | $2,000 | $1.93 | 43d | 1 | 0.78mi |
| 11 Shamrock St Apt 1 Worcester, MA | 3.0 | 1.0 | 1100 | $2,100 | $1.91 | 43d | 1 | 0.79mi |
| 12 E Shelby St Unit 2 Worcester, MA | 3.0 | 1.0 | 1000 | $2,300 | $2.30 | 14d | 1 | 0.80mi |
| 2 Benefit St Unit 2 Worcester, MA | 2.0 | 1.0 | 900 | $1,850 | $2.06 | 43d | 1 | 0.80mi |
| 23 Millbury St Unit 25 Worcester, MA | 3.0 | 1.0 | 1225 | $1,895 | $1.55 | 43d | 1 | 0.82mi |
HOA detail condo
- Monthly dues
- $353 · $4,236/yr
- Likely covers
- gym
- Assessments
- None detected in remarks — confirm with the listing agent.
Listing history 16 events
-
2026-06-18days on market $235,500 Active 37 DOM
-
2026-06-17days on market $235,500 Active 36 DOM
-
2026-06-16days on market $235,500 Active 35 DOM
-
2026-06-15days on market $235,500 Active 34 DOM
-
2026-06-14days on market $235,500 Active 32 DOM
-
2026-06-10days on market $235,500 Active 29 DOM
-
2026-06-09days on market $235,500 Active 28 DOM
-
2026-06-08days on market $235,500 Active 27 DOM
-
2026-06-07days on market $235,500 Active 26 DOM
-
2026-06-05days on market $235,500 Active 23 DOM
-
2026-06-03days on market $235,500 Active 22 DOM
-
2026-06-02days on market $235,500 Active 21 DOM
-
2026-06-01days on market $235,500 Active 20 DOM
-
2026-05-31days on market $235,500 Active 19 DOM
-
2026-05-31days on market $235,500 Active 18 DOM
-
2026-05-12$235,500 New 937-char remark
ⓘ Source: listings_history table (triggers on properties + properties_extension) + one-shot
backfill from property_details.listing_events for pre-trigger history.
Climate risk First Street
- Heat 4/10 Moderate
- Air quality 2/10 Low 1 unhealthy d/yr today · 2 by 30 yrs out
Nearby sold comps map
Loading sold comps map…
Walkable amenities ~0.75 mi
Loading nearby amenities…
Taxation est. · year 1
- Rental income
- $27,974
- − Mortgage interest
- −$13,192
- − Property taxes
- −$3,532
- − Insurance
- −$1,178
- − Repairs & maintenance
- −$2,238
- − Management
- −$2,238
- − HOA
- −$4,236
- − Depreciation
- −$6,851
- Taxable loss
- −$5,491
- Est. tax savings @ 24.0%
- +$1,318
- After-tax cash flow
- $-349/yr
For passive investors: Depreciation is non-cash, so a rental often shows a tax loss while cash-flowing — sheltering income. Rental losses are passive: they offset passive income freely, and up to $25,000/yr can offset ordinary (W-2) income if you actively participate and your MAGI is under $100k (phasing out to $0 by $150k); unused losses carry forward. On sale, claimed depreciation is recaptured at up to 25%, and gains may owe capital-gains tax (a 1031 exchange can defer both). Figures are a year-1 estimate at your 24.0% rate — not tax advice; consult a CPA.
Condition & rehab AI · 1 photo
This beautifully reimagined historic townhouse is in excellent condition with no visible repairs needed. It offers a premium urban living experience with first-class amenities and is ready for immediate occupancy.
Value-add opportunities
- Both Landscaping improvements — Enhances curb appeal and adds value
- Both Interior paint touch-ups — Maintains a fresh and inviting appearance
- Both Window treatments — Improves privacy and aesthetic appeal
Renovation cost estimate screening
Value-add ROI direction
- Both Landscaping improvements — Enhances curb appeal and adds value ↑
- Both Interior paint touch-ups — Maintains a fresh and inviting appearance ↑
- Both Window treatments — Improves privacy and aesthetic appeal ↑
ⓘ Cost ranges are severity-bucket heuristics (US national rule-of-thumb). Get contractor quotes + a written scope before underwriting a rehab budget.
Schools (NCES district)
- District
- Worcester
- NCES district ID
- 2513230
- Math proficiency
- 17% ▼ -15.00%
- Reading proficiency
- 30% ▼ -8.00%
- Median HH income
- $45,063
- Composite
- 20.3/100
- National rank
- #8615
- State rank
- #280 of 302 in MA
Livability — Worcester
- Score
- 87/100
- State rank
- #9
- US rank
- #312
Category grades
Schools grade is shown separately in the Schools card above.
Census & demographics
- Census place
- Worcester, MA
- County
- Worcester County · 487,911 people
- City population
- 207,324
- Metro
- Worcester, MA-CT
- Population (ZIP)
- 4,932
- Household income
- $45,687
- Rent vs Own
- Severe rent burden
- 623.0
Population outlook (Worcester County) Hauer SSP2
- Today (2025)
- 850,858 people
- By 2030
- 860,403 · +1.1%
- By 2040
- 869,902 · +2.2%
- By 2050
- 869,110 · +2.1%
- By 2075
- 870,120 · +2.3%
- By 2100
- 829,703 · -2.5%
Race, ethnicity, and origin ACS 2023
- Neighborhood character
- Diverse neighborhood (Simpson 0.68)
- Race & ethnicity
- Hispanic / Latino 48% White 26% Two or more races 22% Black 11% Asian 8% Native American 7%
- Hispanic origin (detail)
- Puerto Rican 31% Dominican 12%
- Common ancestry
- Lithuanian 3% Romanian 2% Hispanic 1%
- Foreign-born
- 28% · Canada, China, Vietnam
- Languages at home
- 46% English-only · Spanish 36% Chinese 3% French/Haitian/Cajun 3%
Political lean MEDSL · Worcester
- 2024 margin
- D (+10.0) · D 53.9% · R 43.9% · Other 2.2%
- 2008→2024 swing
- -3.8pp toward R · 2008: 13.8pp · 2024: 10.0pp
- All cycles
- 2024: D+10.0 2020: D+17.8 2016: D+10.5 2012: D+9.2 2008: D+13.8
Not yet ingested
- Civics
- —
Market trends
- HPI YoY
- ▲ 2.29%
- Current HPI
- 341.6785
- Rent YoY
- ▲ 7.80%
- Metro
- Worcester, MA-CT
- State GDP YoY
- ▲ 2.28%
- F500 in state
- 38
Industry mix (Fortune 500 HQ in MA)
| Industry | F500 HQs | Revenue |
|---|---|---|
| Technology | 3 | $17B |
|
||
| Insurance | 2 | $84B |
|
||
| Retail | 2 | $76B |
|
||
| Life Sciences | 1 | $43B |
|
||
| Energy Technology | 1 | $31B |
|
||
| Aerospace / Defense | 1 | $18B |
|
||
Price history
1 event — show timeline
- 2026-05-12 Listed $235,500 MLS PIN
Cash-flow waterfall
monthlySold comps — $/sqft
last 12 mo · ≤1 miLoading sold comps…