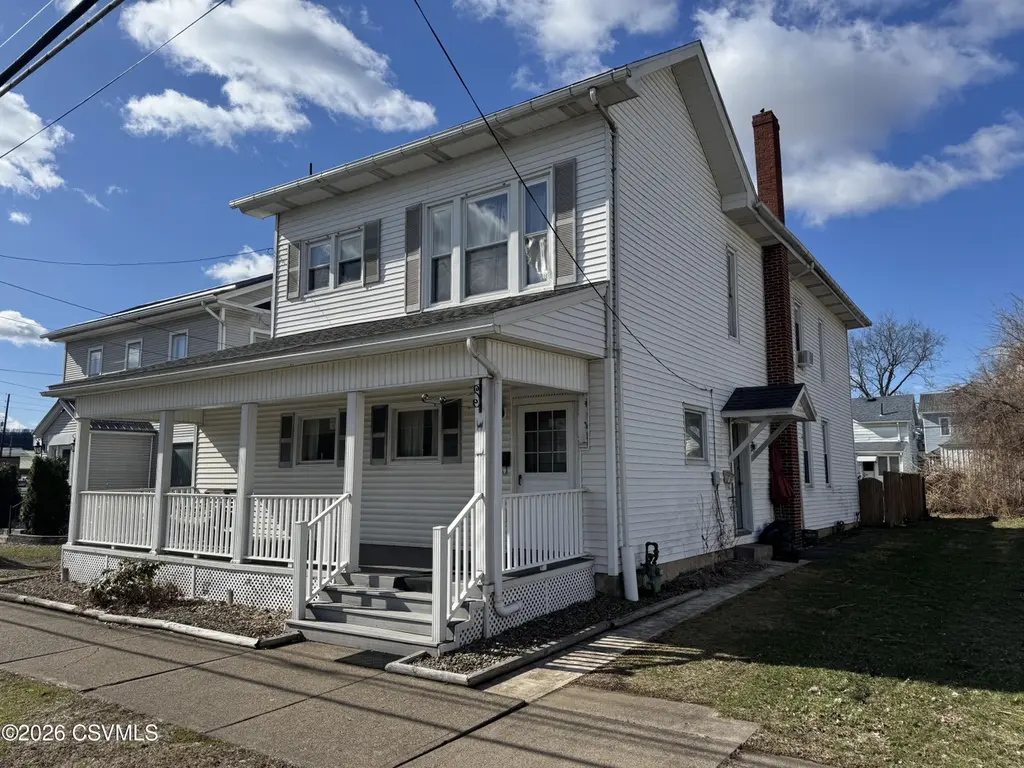
329-331 Market St
Berwick, PA 18603
$248,900B+
9 bd · 7.5 ba ·
3,378 sqft ·
Built 1900
· MultiFamily
· Pending
· 17 DOM
Cashflow @ list (25.0% down · 7.5%)
Estimated rent
$4,501/mo
Mortgage (P&I)
−$1,305
Tax + insurance
−$415
HOA
−$0
Vac / Maint / Mgmt
−$945
Net cashflow
$1,836/mo
Annual
$22,028/yr
Cap rate
15.14%
Cash-on-cash
31.61%
DSCR
2.41
1% rule
1.81%
Cash to close
$69,692
Investor read
- This is a 3 × 3-bed/2.5-bath units multifamily listed at $249k. Condition is rated fair.
- At list price, monthly cash flow is $2k ($22k/yr) — positive. Per door: $612/mo.
- The deal already cash-flows at list — no discount required.
- Meets the 1% rule at list price ($5k rent vs $249k).
- It's been on market 17 days — a 2% lower offer ($245k) is reasonable based on typical stale-listing flexibility.
- Recommended offer: $245k (1.5% below list) — sets the bar for market timing.
- Local home prices are declining (-3.0%/yr); year-one equity from $2k of loan paydown is wiped out by about $7k of value loss. Plan a longer hold.
- Location reads 76/100 on livability (#412 in PA, #3,762 nationally) — a middle-class / working-renter tenant base. Strengths: crime A+, cost of living A+, housing A+; Watch: amenities F, commute F, employment F.
- Berwick Area SD (other): math 32% / reading 57% proficiency, ranked #291 of 539 in PA (top 54%) — families likely to look elsewhere, expect single-tenant / working-renter base with shorter leases.
- Zoned schools: Berwick Area Ms (math 19% / reading 54%, grade F, #307 of 512 statewide, top 61%, 844 students, 100% FRL); Berwick Area Hs (math 57% / reading 70%, grade B-, #69 of 437 statewide, top 16%, 782 students, 100% FRL) — zoned schools average 100% FRL vs 46% district-wide (54 pts higher); higher-poverty schools than district average — tighter screening recommended.
- Watch-outs: built in 1900 — expect roof / HVAC / electrical / plumbing capex.
- Market conditions: 90 active listings in the ZIP; 82 units permitted in Columbia County in 2024 (0 in 5+ unit buildings).
- Columbia County population projected at -12% by 2050 — secular population decline; favor cash flow + early exit over multi-decade hold.
- At projected returns (-3.0% appreciation + 3.0% rent growth), your $70k cash investment doubles in ~4 years — after that, you're playing with house money.
- Cap rate 15.1% vs local median 5.4% in Berwick — top-decile yield for the area; either an underpriced asset or a hidden risk that comps aren't pricing in. Stress-test before assuming the spread holds.
Questions for listing agent
- Can we see the unit-by-unit rent roll, current vacancy, and any below-market leases? What's the average tenancy length?
- What capital expenditures (roof, boiler, parking lot, exteriors) have been made in the last 5 years, and what's planned in the next 2?
- Have any recent inspections been done? Can we get a copy of the seller's disclosures and any deferred-maintenance estimates?
- Built in 1900 — when were the roof, HVAC, electrical panel, plumbing, and water heater last replaced?
- Is there a deadline driving the sale (1031 exchange, divorce, estate, relocation)? That informs how much negotiation room exists.
- Schools are B-rated — typically a magnet for longer-tenancy family renters. What's the average tenant stay here, and is there a school-zone premium baked into asking?
- What's the average days-on-market for RENTAL listings here right now (not sales)? A rising rental-DOM trend means longer vacancies and softer asking-rent achievability than the comps imply.
- What's the recent tenant-quality profile in this submarket — average credit score on applications, eviction rate, late-payment / NSF rate, and stable-employment percentage? A property-management company in the area should have these aggregated.
Repairs flagged (vision-AI assessment)
- Major: kitchen cabinets — poor condition
- Major: bathroom fixtures — poor condition
- Major: kitchen flooring — dated and worn
- Major: bathroom flooring — dated and worn
CashFlowRE · CFR-NAH24C946JK2DT
· Data 4 weeks ago
cashflowre.app · 2026-05-29