 Triplex
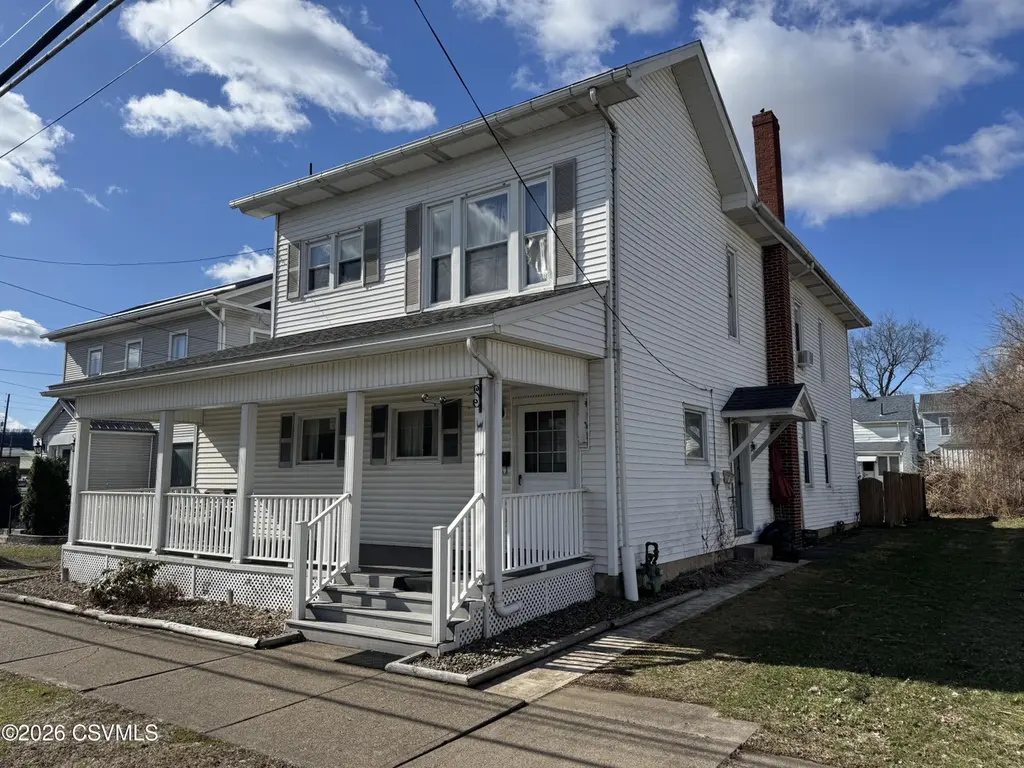
329-331 Market St · Berwick, PA
Flood risk No data
- FEMA flood zone
- —
- Chance of flooding over 30 yrs
- —
- Est. flood insurance / yr
- —
Fire risk No data
- Est. fire insurance / yr
- —
Heat risk No data
- Hot days now (above threshold)
- —
- Hot days in 30 yrs
- —
Wind risk No data
- Chance of severe wind over 30 yrs
- —
Air-quality risk No data
- Unhealthy air days now
- —
- Unhealthy air days in 30 yrs
- —
Risk factors via First Street. Map © Google.
Why this score? — see what drove the B+ grade
The composite is a weighted blend of 9 inputs, each scored 0–100. Each bar is that input's sub-score; the figure is the points it added to the 100-point composite (weight × sub-score).
- Cash flow +30.0/30.0
- ARV discount +13.0/15.0
- 1% rule +10.0/10.0
- DSCR +10.0/10.0
- Livability +3.8/5.0
- Schools +3.7/10.0
- Rent growth +2.5/5.0
- Condition / age +2.2/5.0
- Appreciation +0.0/10.0
$248,900
🖨 Deal sheet (PDF) 📄 Offer letter ✓ Due diligence
Multi-family units
County records classify this as Multi-Family (2-4 Unit). Listing-text estimate: 3 units. confirmed
Listing remarks
Commercially zoned 3-unit property in a highly convenient location close to shopping, dining, more. This versatile property offers multiple income streams and strong potential for both investors and owner-occupants. Each unit provides functional living space with separate entrances, offering flexibility for tenants. Property features include ample parking and a layout conducive to steady rental demand. This is an ideal opportunity to add to your portfolio or establish a presence in a commercially zoned location with built-in income. Don't miss this opportunity to own a multi-unit property in a prime location. Call or text Jesse or Sheila today for your private tour. 570-760-1363
Key facts
- Ample parking
- Separate entrances
- Steady rental demand
Tags
Neighborhood map
What this means for you Summary
Snapshot
- This is a 3 × 3-bed/2.5-bath units multifamily listed at $249k. Condition is rated fair.
Deal economics
- At list price, monthly cash flow is $2k ($22k/yr) — positive. Per door: $612/mo.
- The deal already cash-flows at list — no discount required.
- Meets the 1% rule at list price ($5k rent vs $249k).
- Recommended offer: $245k (1.5% below list) — sets the bar for market timing.
- Cap rate 15.1% vs local median 5.4% in Berwick — top-decile yield for the area; either an underpriced asset or a hidden risk that comps aren't pricing in. Stress-test before assuming the spread holds.
Location & tenants
- Location reads 76/100 on livability (#412 in PA, #3,762 nationally) — a middle-class / working-renter tenant base. Strengths: crime A+, cost of living A+, housing A+; Watch: amenities F, commute F, employment F.
- Berwick Area SD (other): math 32% / reading 57% proficiency, ranked #291 of 539 in PA (top 54%) — families likely to look elsewhere, expect single-tenant / working-renter base with shorter leases.
- Market conditions: 86 active listings in the ZIP; 82 units permitted in Columbia County in 2024 (0 in 5+ unit buildings).
Forward outlook
- Local home prices are declining (-3.0%/yr); year-one equity from $2k of loan paydown is wiped out by about $7k of value loss. Plan a longer hold.
- Columbia County population projected at -12% by 2050 — secular population decline; favor cash flow + early exit over multi-decade hold.
- At projected returns (-3.0% appreciation + 3.0% rent growth), your $70k cash investment doubles in ~4 years — after that, you're playing with house money.
Negotiation context
- It's been on market 17 days — a 2% lower offer ($245k) is reasonable based on typical stale-listing flexibility.
Risks & watch-outs
- Watch-outs: built in 1900 — expect roof / HVAC / electrical / plumbing capex.
Questions for the listing agent
- Can we see the unit-by-unit rent roll, current vacancy, and any below-market leases? What's the average tenancy length?
- What capital expenditures (roof, boiler, parking lot, exteriors) have been made in the last 5 years, and what's planned in the next 2?
- Have any recent inspections been done? Can we get a copy of the seller's disclosures and any deferred-maintenance estimates?
- Built in 1900 — when were the roof, HVAC, electrical panel, plumbing, and water heater last replaced?
- Is there a deadline driving the sale (1031 exchange, divorce, estate, relocation)? That informs how much negotiation room exists.
- Schools are B-rated — typically a magnet for longer-tenancy family renters. What's the average tenant stay here, and is there a school-zone premium baked into asking?
- What's the average days-on-market for RENTAL listings here right now (not sales)? A rising rental-DOM trend means longer vacancies and softer asking-rent achievability than the comps imply.
- What's the recent tenant-quality profile in this submarket — average credit score on applications, eviction rate, late-payment / NSF rate, and stable-employment percentage? A property-management company in the area should have these aggregated.
- How much new apartment / multifamily construction is in the pipeline within 1–3 miles? Heavy new supply (>2% of stock underway) typically softens rents 12–24 months out; light construction supports rent growth.
Investment metrics
- 1% rule
- 1.81% ✓
- Cap rate
- 15.14%
- Cash-on-cash
- 31.61%
- DSCR
- 2.41
- GRM
- 4.6
CMA / ARV
- ARV (on-the-fly)
- $283,752
- Comps found
- 1
Show comp detail 1 sale within ~0.75 mi
| Address | Dist | Beds/Ba | Sqft | Sold | Price | $/sf | Match |
|---|---|---|---|---|---|---|---|
| 1400 Pine St | 0.63mi | 8/4.0 (-1) | 3,640 (+8%) | 8mo | $305,000 | $84 | 32 |
Match score weights: distance 35% · size 25% · config 20% · recency 20%. Top-matched comps best support the ARV.
Projected returns pro-forma
-3.0% appreciation · 3.0% rent growth · sell at horizon
- IRR
- 26.5%
- Equity multiple
- 2.10×
- Total profit
- $76,652
- Equity at exit
- $37,112
- IRR
- 34.1%
- Equity multiple
- 4.12×
- Total profit
- $217,572
- Equity at exit
- $21,520
Cash invested: $69,692 (down + closing). Projections, not guarantees.
Landlord ↔ Tenant lean methodology
- Overall (STATE)
- 62 Landlord-Friendly
- State Pennsylvania
- 62 Landlord-Friendly · EVEN
- County
- — inherits STATE
- City
- — inherits STATE
ZIP-level market 18603
- Active inventory
- 86
- Price-to-rent
- 13.8×
Monthly cashflow live
- Estimated rent
- $4,501 medium interval (Pro) →
- Mortgage (P&I)
- −$1,305
- Tax est. 1.5%
- −$311 /mo · $3,734/yr
- Insurance
- −$104
- HOA
- −$0
- Vacancy / Maint / Mgmt
- −$945
- Net cashflow
- $1,836
Break-even live
Sensitivity live
| Price | -10% $2,008 | -5% $1,922 | +0% $1,836 | +5% $1,750 | +10% $1,664 |
|---|---|---|---|---|---|
| Rent | -10% $1,480 | -5% $1,658 | +0% $1,836 | +5% $2,013 | +10% $2,191 |
| Rate | -1.0pp $1,961 | -0.5pp $1,899 | base $1,836 | +0.5pp $1,771 | +1.0pp $1,706 |
3-unit breakdown (identical units grouped — click to expand)
| Units | Beds | Baths | Est. rent |
|---|---|---|---|
| 3× units | 3 | 2.5 | $4,500 |
| #1 | 3 | 2.5 | $1,500 |
| #2 | 3 | 2.5 | $1,500 |
| #3 | 3 | 2.5 | $1,500 |
| Total (3 units) | $4,501 | ||
UW: 25.0% down · 7.5% · 30yr · 1.5% tax · 5.0% vac · 8.0% maint · 8.0% mgmt
Financing live
Cash to close
- Down payment
- $62,225
- Closing costs
- $7,467
- Reserves months
- —
- Total cash needed
- —
Loan-product check · same deal, 3 products live
Conventional
25% down · 7.5% · 30yr
- Down + closing
- —
- Monthly P&I
- —
- Monthly cashflow
- —
- DSCR
- —
- Eligible?
- —
Personal DTI + credit; lowest rate.
DSCR
20% down · 8.5% · 30yr
- Down + closing
- —
- Monthly P&I
- —
- Monthly cashflow
- —
- DSCR
- —
- Eligible?
- —
No personal income docs; deal must DSCR.
Hard money
10% down · 12.0% · 12mo
- Down + closing
- —
- Monthly P&I
- —
- Monthly cashflow
- —
- DSCR
- —
- Eligible?
- —
Short-term bridge; refi at stabilization.
Listing history 2 events
-
2026-04-03status Pending
-
2026-03-17$248,900 Active
ⓘ Source: listings_history table (triggers on properties + properties_extension) + one-shot
backfill from property_details.listing_events for pre-trigger history.
Nearby sold comps map
Loading sold comps map…
Walkable amenities ~0.75 mi
Loading nearby amenities…
Taxation est. · year 1
- Rental income
- $54,012
- − Mortgage interest
- −$13,942
- − Property taxes
- −$3,734
- − Insurance
- −$1,244
- − Repairs & maintenance
- −$4,321
- − Management
- −$4,321
- − Depreciation
- −$7,241
- Taxable income
- $19,209
- Est. tax owed @ 24.0%
- −$4,610
- After-tax cash flow
- $17,418/yr
For passive investors: Depreciation is non-cash, so a rental often shows a tax loss while cash-flowing — sheltering income. Rental losses are passive: they offset passive income freely, and up to $25,000/yr can offset ordinary (W-2) income if you actively participate and your MAGI is under $100k (phasing out to $0 by $150k); unused losses carry forward. On sale, claimed depreciation is recaptured at up to 25%, and gains may owe capital-gains tax (a 1031 exchange can defer both). Figures are a year-1 estimate at your 24.0% rate — not tax advice; consult a CPA.
Condition & rehab AI · 12 photos
This 3-unit property requires moderate renovations to update the kitchens and bathrooms, which will significantly increase its resale and rental value.
Repairs flagged
- Major kitchen cabinets — poor condition
- Major bathroom fixtures — poor condition
- Major kitchen flooring — dated and worn
- Major bathroom flooring — dated and worn
Value-add opportunities
- Both update kitchen and bathrooms — modernizing will attract both buyers and renters
- Both landscaping and curb appeal — improving the exterior will increase curb appeal and attract more tenants
Renovation cost estimate screening
| Repair item | Severity | Est. cost |
|---|---|---|
| kitchen cabinets · poor condition | Major | $15,000–50,000 |
| bathroom fixtures · poor condition | Major | $15,000–50,000 |
| kitchen flooring · dated and worn | Major | $15,000–50,000 |
| bathroom flooring · dated and worn | Major | $15,000–50,000 |
| Total estimated repair cost · 4 items | $60,000–200,000 |
Value-add ROI direction
- Both update kitchen and bathrooms — modernizing will attract both buyers and renters ↑
- Both landscaping and curb appeal — improving the exterior will increase curb appeal and attract more tenants ↑
ⓘ Cost ranges are severity-bucket heuristics (US national rule-of-thumb). Get contractor quotes + a written scope before underwriting a rehab budget.
Schools (NCES district)
- District
- Berwick Area SD
- NCES district ID
- 4203480
- Math proficiency
- 32% ▼ -14.00%
- Reading proficiency
- 57% ▼ -6.00%
- Median HH income
- $41,964
- Composite
- 37.36/100
- National rank
- #4433
- State rank
- #291 of 539 in PA
Livability — Berwick
- Score
- 76/100
- State rank
- #412
- US rank
- #3762
Category grades
Schools grade is shown separately in the Schools card above.
Census & demographics
- Census place
- Berwick, PA
- Population (ZIP)
- 18,985
Population outlook (Columbia County) Hauer SSP2
- Today (2025)
- 65,170 people
- By 2030
- 64,054 · -1.7%
- By 2040
- 61,131 · -6.2%
- By 2050
- 57,526 · -11.7%
- By 2075
- 50,259 · -22.9%
- By 2100
- 44,756 · -31.3%
Race, ethnicity, and origin ACS 2023
- Neighborhood character
- Predominantly White (91%)
- Race & ethnicity
- White 91% Hispanic / Latino 4% Two or more races 3% Black 3%
- Common ancestry
- Romanian 6% Polish 4% Iranian 3%
- Foreign-born
- 3% · Canada
- Languages at home
- 97% English-only · Spanish 2% Russian/Polish/Slavic 1%
Political lean MEDSL · Columbia
- 2024 margin
- Solid R (+31.0) · D 34.0% · R 65.0%
- 2008→2024 swing
- -26.6pp toward R · 2008: -4.5pp · 2024: -31.0pp
- All cycles
- 2024: R+31.0 2020: R+30.7 2016: R+32.8 2012: R+12.4 2008: R+4.5
Not yet ingested
- Civics
- —
Market trends
- HPI YoY
- ▼ -123.40%
- Current HPI
- 211.5643
- Rent YoY
- —
- Metro
- —
- State GDP YoY
- ▲ 1.68%
- F500 in state
- 34
Industry mix (Fortune 500 HQ in PA)
| Industry | F500 HQs | Revenue |
|---|---|---|
| Healthcare | 2 | $309B |
|
||
| Insurance | 2 | $27B |
|
||
| Telecommunications / Media | 1 | $124B |
|
||
| Industrial Distribution | 1 | $22B |
|
||
| Financial Services | 1 | $20B |
|
||
| Chemicals / Materials | 1 | $18B |
|
||
Price history
2 events — show timeline
- 2026-04-03 Pending — CSVBR
- 2026-03-17 Listed $248,900 CSVBR
Cash-flow waterfall
monthlySold comps — $/sqft
last 12 mo · ≤1 miLoading sold comps…