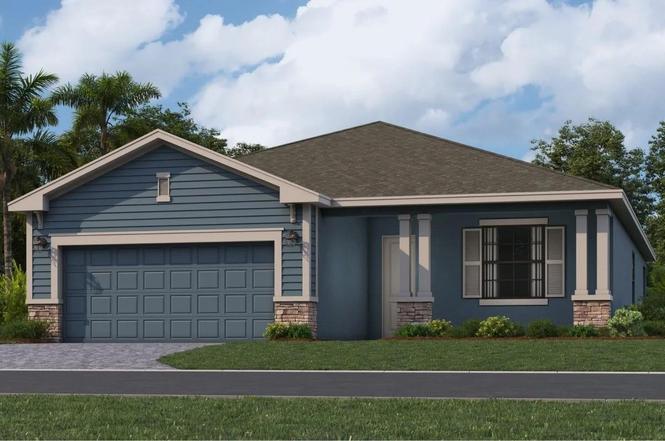
3536 Night Star Ter
Lakewood Ranch, FL 34219
$332,500F
3 bd · 3.0 ba ·
1,849 sqft ·
Built 2025
· Land
· Pending
· 11 DOM
Cashflow @ list (25.0% down · 7.5%)
Estimated rent
$2,617/mo
Mortgage (P&I)
−$1,744
Tax + insurance
−$366
HOA
−$266
Vac / Maint / Mgmt
−$550
Net cashflow
$-308/mo
Annual
$-3,698/yr
Cap rate
5.18%
Cash-on-cash
-3.97%
DSCR
0.82
1% rule
0.79%
Cash to close
$93,100
Investor read
- This is a 3-bed/3.0-bath land listed at $332k.
- At list price, monthly cash flow is $-308 ($-4k/yr) — negative.
- To cash-flow at today's rent, offer at most $278k (16.4% below list).
- To meet the 1% rule (rent ≥ 1% of price), the offer needs to be $262k (21.3% below list).
- Only 11 days on market — expect competitive offers; lowballing is unlikely to land.
- Recommended offer: $262k (21.3% below list) — sets the bar for 1% rule.
- Local home prices are declining (-3.0%/yr); year-one equity from $2k of loan paydown is wiped out by about $10k of value loss. Plan a longer hold.
- Location reads: area grade F — affects rentability + tenant quality, not the cash-flow math above.
- Manatee (suburban): math 54% / reading 50% proficiency, ranked #26 of 73 in FL (top 36%) — acceptable for families but not a draw, mixed tenant base, ~2y average lease.
- Zoned schools: Gene Witt Elementary School (math 84% / reading 82%, grade A+, #65 of 2,144 statewide, top 3%, 689 students, 24% FRL); Buffalo Creek Middle School (math 59% / reading 51%, grade B-, #180 of 571 statewide, top 32%, 1,127 students, 44% FRL); Palmetto High School (math 22% / reading 36%, grade F, #456 of 667 statewide, top 68%, 2,100 students, 61% FRL).
- Market conditions: Rents soft (-0.9%/yr); 2194 active listings in the ZIP; 1 comparable units currently listed for rent nearby; high-income renter base; 7,472 units permitted in Manatee County in 2024 (1,782 in 5+ unit buildings).
- Manatee County population projected at +43% by 2050 — long-run rental-demand tailwind backs the buy-and-hold thesis.
- 2 sale attempts; this cycle's ask has dropped $80k (19%) from the opening price — seller is motivated, your offer sets the floor, not the list.
- Cap rate 5.2% vs local median 3.3% in Lakewood Ranch — top-decile yield for the area; either an underpriced asset or a hidden risk that comps aren't pricing in. Stress-test before assuming the spread holds.
Questions for listing agent
- What do current leases actually rent for vs. the listed asking? Can we see a recent rent roll and the last 12 months of T-12 income?
- What does the HOA fee cover, when was the last increase, and are there any pending special assessments or reserve-fund shortfalls?
- Is there a deadline driving the sale (1031 exchange, divorce, estate, relocation)? That informs how much negotiation room exists.
- The area grade is low — what's the realistic commute time and amenity access for the typical tenant pool here? Any planned neighborhood developments (good or bad) we should know about?
- What's the average days-on-market for RENTAL listings here right now (not sales)? A rising rental-DOM trend means longer vacancies and softer asking-rent achievability than the comps imply.
- What's the recent tenant-quality profile in this submarket — average credit score on applications, eviction rate, late-payment / NSF rate, and stable-employment percentage? A property-management company in the area should have these aggregated.
- How much new for-sale + rental construction is in the pipeline within 1–3 miles? Heavy new supply typically softens prices + rents 12–24 months out; constrained supply supports both.
CashFlowRE · CFR-NAMXTGFN66949Y
· Data 1 week ago
cashflowre.app · 2026-05-29