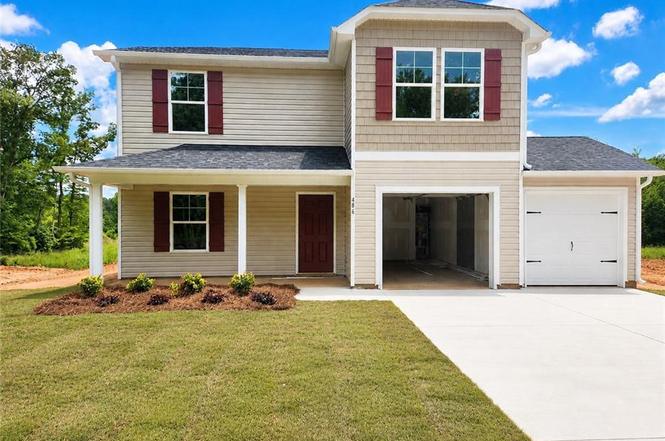
486 Grubb Rd
Lexington, NC 27295
$271,997D-
4 bd · 2.5 ba ·
1,710 sqft ·
Built 2026
· SingleFamily
· Active
· 118 DOM
Cashflow @ list (25.0% down · 7.5%)
Estimated rent
$2,253/mo
Mortgage (P&I)
−$1,426
Tax + insurance
−$453
HOA
−$0
Vac / Maint / Mgmt
−$473
Net cashflow
$-100/mo
Annual
$-1,200/yr
Cap rate
5.85%
Cash-on-cash
-1.58%
DSCR
0.93
1% rule
0.83%
Cash to close
$76,159
Investor read
- This is a 4-bed/2.5-bath single-family listed at $272k.
- At list price, monthly cash flow is $-100 ($-1k/yr) — negative.
- To cash-flow at today's rent, offer at most $258k (5.3% below list).
- To meet the 1% rule (rent ≥ 1% of price), the offer needs to be $225k (17.2% below list).
- It's been on market 118 days — a 9% lower offer ($248k) is reasonable based on typical stale-listing flexibility.
- Recommended offer: $225k (17.2% below list) — sets the bar for 1% rule.
- Local home prices are declining (-3.0%/yr); year-one equity from $2k of loan paydown is wiped out by about $8k of value loss. Plan a longer hold.
- Location reads 72/100 on livability (#89 in NC) — a middle-class / working-renter tenant base. Strengths: commute A+, cost of living A+, health & safety A+; Watch: crime F, amenities D-, employment F.
- Davidson County Schools (rural): math 50% / reading 50% proficiency, ranked #62 of 178 in NC (top 35%) — acceptable for families but not a draw, mixed tenant base, ~2y average lease.
- Zoned schools: Reeds Elementary (math 47% / reading 47%, grade D-, #497 of 1,410 statewide, top 38%, 266 students, 67% FRL); Tyro Middle (math 34% / reading 44%, grade F, #238 of 475 statewide, top 51%, 561 students, 58% FRL); West Davidson High (math 57% / reading 52%, grade C-, #270 of 535 statewide, top 52%, 725 students, 50% FRL) — zoned schools average 58% FRL vs 39% district-wide (20 pts higher); higher-poverty schools than district average — tighter screening recommended.
- Market conditions: Rents rising (+3.4%/yr); 351 active listings in the ZIP; 2 comparable units currently listed for rent nearby; 990 units permitted in Davidson County in 2024 (54 in 5+ unit buildings).
- Davidson County population projected to shrink 6% by 2050 — rents likely to lag national; underwrite the cash flow, not the appreciation.
- Climate carrying-cost: extreme-heat days projected 7→16/yr by 2055 (HVAC capex compounding) — expect insurance premiums to compound above CPI over the hold.
- Cap rate 5.9% vs local median 3.5% in Lexington — top-decile yield for the area; either an underpriced asset or a hidden risk that comps aren't pricing in. Stress-test before assuming the spread holds.
- This rent runs 42% of the median local income ($64k/yr) — at the standard rent-burdened threshold; future hikes will face affordability resistance.
Questions for listing agent
- What do current leases actually rent for vs. the listed asking? Can we see a recent rent roll and the last 12 months of T-12 income?
- It's been on market 118 days. Have you received any prior offers? Is the seller open to a 17% concession, seller financing, or rate buy-down credit?
- Why hasn't it sold? Are there any deal-killer items the seller is aware of (foundation, flood, title, zoning, code violations)?
- Is there a deadline driving the sale (1031 exchange, divorce, estate, relocation)? That informs how much negotiation room exists.
- Schools are D-rated, which usually means shorter tenancies and higher turnover. Who's the typical renter profile here, and what's been the actual vacancy rate?
- Crime grade is F in this area — have there been break-ins, vandalism, or insurance claims at this property in the last 3 years? What carrier currently insures it and at what premium?
- The area grade is low — what's the realistic commute time and amenity access for the typical tenant pool here? Any planned neighborhood developments (good or bad) we should know about?
- What's the average days-on-market for RENTAL listings here right now (not sales)? A rising rental-DOM trend means longer vacancies and softer asking-rent achievability than the comps imply.
CashFlowRE · CFR-NARTS951RC5DNE
· Data 2 days ago
cashflowre.app · 2026-05-29