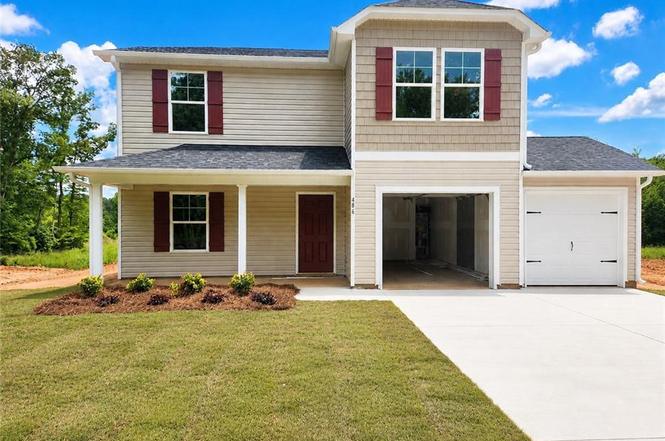
486 Grubb Rd · Lexington, NC
Flood risk 4/10 · Minor
- FEMA flood zone
- X (unshaded)
- Chance of flooding over 30 yrs
- 0.22%
- Est. flood insurance / yr
- $507 – $1,088
Fire risk 2/10 · Minimal
- Est. fire insurance / yr
- $906 – $1,684
Heat risk 5/10 · Moderate
- Hot days now (above 103°F)
- 7 days/yr
- Hot days in 30 yrs
- 16 days/yr
Wind risk 4/10 · Minor
- Chance of severe wind over 30 yrs
- 10.0%
Air-quality risk 2/10 · Minimal
- Unhealthy air days now
- 1 days/yr
- Unhealthy air days in 30 yrs
- 2 days/yr
Risk factors via First Street. Map © Google.
Why this score? — see what drove the D- grade
The composite is a weighted blend of 9 inputs, each scored 0–100. Each bar is that input's sub-score; the figure is the points it added to the 100-point composite (weight × sub-score).
- Cash flow +11.3/30.0
- ARV discount +8.0/15.0
- Schools +4.3/10.0
- Livability +3.6/5.0
- 1% rule +3.3/10.0
- DSCR +3.3/10.0
- Rent growth +3.3/5.0
- Condition / age +2.5/5.0
- Appreciation +0.0/10.0
$271,997
🖨 Deal sheet 📄 Offer letter ✓ Due diligence
Listing remarks
New construction in Lexington with over 1700 sq ft, 4 bedrooms, 2.5 bathrooms, and a 2-car garage. Main level open floor plan with additional den/flex room. Granite countertops and stainless-steel appliances in the kitchen. Large primary bedroom with vaulted ceiling and walk-in closet. Rear patio and covered front porch. No HOA.
Key facts
- Covered front porch
- Open floor plan
- Den flex room
Tags
Property features AI
Finance
- HOA & community: No association
Exterior
- Parking: Attached garage (2 spaces); Driveway
- Utilities: Septic tank sewer; Electric water heater; Public water
- Home design: Residential stick/site-built house; New construction (built 2026); Two levels; Slab entry/foundation
- Construction: Vinyl siding; Slab foundation; New construction (2026)
- Exterior features: No fencing; Public water; Road maintenance agreement
Interior
- Kitchen: Microwave; Dishwasher; Free-standing range
- Bedrooms: Main-level bedroom (Den); Second-level bedrooms (multiple): dimensions include 12'10" x 17'0", 12'0" x 12'6", 11'2" x 12'0", 10'9" x 11'10"
- Flooring: Carpet; Vinyl
- Bathrooms: 2 full bathrooms; 1 half bathroom
- Heating & cooling: Heat pump for heating and cooling; Electric heating fuel
- Interior features: Ceiling fans; Pantry; Vaulted ceilings
- Laundry & utility: Washer hookup; Dryer connection on main level; Electric water heater
Neighborhood map
What this means for you Summary
Snapshot
- This is a 4-bed/2.5-bath single-family listed at $272k.
Deal economics
- At list price, monthly cash flow is $-100 ($-1k/yr) — negative.
- To cash-flow at today's rent, offer at most $258k (5.3% below list).
- To meet the 1% rule (rent ≥ 1% of price), the offer needs to be $225k (17.2% below list).
- Recommended offer: $225k (17.2% below list) — sets the bar for 1% rule.
- Cap rate 5.9% vs local median 3.5% in Lexington — top-decile yield for the area; either an underpriced asset or a hidden risk that comps aren't pricing in. Stress-test before assuming the spread holds.
Location & tenants
- Location reads 72/100 on livability (#89 in NC) — a middle-class / working-renter tenant base. Strengths: commute A+, cost of living A+, health & safety A+; Watch: crime F, amenities D-, employment F.
- Davidson County Schools (rural): math 50% / reading 50% proficiency, ranked #62 of 178 in NC (top 35%) — acceptable for families but not a draw, mixed tenant base, ~2y average lease.
- Zoned schools: Reeds Elementary (math 47% / reading 47%, grade D-, #497 of 1,410 statewide, top 38%, 266 students, 67% FRL); Tyro Middle (math 34% / reading 44%, grade F, #238 of 475 statewide, top 51%, 561 students, 58% FRL); West Davidson High (math 57% / reading 52%, grade C-, #270 of 535 statewide, top 52%, 725 students, 50% FRL) — zoned schools average 58% FRL vs 39% district-wide (20 pts higher); higher-poverty schools than district average — tighter screening recommended.
- Market conditions: Rents rising (+3.4%/yr); 351 active listings in the ZIP; 2 comparable units currently listed for rent nearby; 990 units permitted in Davidson County in 2024 (54 in 5+ unit buildings).
- This rent runs 42% of the median local income ($64k/yr) — at the standard rent-burdened threshold; future hikes will face affordability resistance.
Forward outlook
- Local home prices are declining (-3.0%/yr); year-one equity from $2k of loan paydown is wiped out by about $8k of value loss. Plan a longer hold.
- Davidson County population projected to shrink 6% by 2050 — rents likely to lag national; underwrite the cash flow, not the appreciation.
Negotiation context
- It's been on market 118 days — a 9% lower offer ($248k) is reasonable based on typical stale-listing flexibility.
Risks & watch-outs
- Climate carrying-cost: extreme-heat days projected 7→16/yr by 2055 (HVAC capex compounding) — expect insurance premiums to compound above CPI over the hold.
Questions for the listing agent
- What do current leases actually rent for vs. the listed asking? Can we see a recent rent roll and the last 12 months of T-12 income?
- It's been on market 118 days. Have you received any prior offers? Is the seller open to a 17% concession, seller financing, or rate buy-down credit?
- Why hasn't it sold? Are there any deal-killer items the seller is aware of (foundation, flood, title, zoning, code violations)?
- Is there a deadline driving the sale (1031 exchange, divorce, estate, relocation)? That informs how much negotiation room exists.
- Schools are D-rated, which usually means shorter tenancies and higher turnover. Who's the typical renter profile here, and what's been the actual vacancy rate?
- Crime grade is F in this area — have there been break-ins, vandalism, or insurance claims at this property in the last 3 years? What carrier currently insures it and at what premium?
- The area grade is low — what's the realistic commute time and amenity access for the typical tenant pool here? Any planned neighborhood developments (good or bad) we should know about?
- What's the average days-on-market for RENTAL listings here right now (not sales)? A rising rental-DOM trend means longer vacancies and softer asking-rent achievability than the comps imply.
- What's the recent tenant-quality profile in this submarket — average credit score on applications, eviction rate, late-payment / NSF rate, and stable-employment percentage? A property-management company in the area should have these aggregated.
- How much new for-sale + rental construction is in the pipeline within 1–3 miles? Heavy new supply typically softens prices + rents 12–24 months out; constrained supply supports both.
Investment metrics
- 1% rule
- 0.83% ✗
- Cap rate
- 5.85%
- Cash-on-cash
- -1.58%
- DSCR
- 0.93
- GRM
- 10.1
CMA / ARV
- ARV (on-the-fly)
- $275,310
- Comps found
- 1
Show comp detail 1 sale within ~0.75 mi
| Address | Dist | Beds/Ba | Sqft | Sold | Price | $/sf | Match |
|---|---|---|---|---|---|---|---|
| 807 Rowe Rd | 0.28mi | 3/2.0 (-1) | 1,958 (+14%) | 13mo | $315,000 | $161 | 45 |
Match score weights: distance 35% · size 25% · config 20% · recency 20%. Top-matched comps best support the ARV.
Projected returns pro-forma
-3.0% appreciation · 3.37% rent growth · sell at horizon
- IRR
- -18.5%
- Equity multiple
- 0.35×
- Total profit
- $-49,570
- Equity at exit
- $40,556
- IRR
- -10.1%
- Equity multiple
- 0.37×
- Total profit
- $-47,750
- Equity at exit
- $23,517
Cash invested: $76,159 (down + closing). Projections, not guarantees.
Landlord ↔ Tenant lean methodology
- Overall (STATE)
- 85 Strongly Landlord-Friendly
- State North Carolina
- 85 Strongly Landlord-Friendly · R+3
- County
- — inherits STATE
- City
- — inherits STATE
ZIP-level market 27295
- Home prices YoY
- -15.2%
- Rents YoY
- 3.4%
- Active inventory
- 351
- Price-to-rent
- 10.1×
Monthly cashflow live
- Estimated rent
- $2,253 medium interval (Pro) →
- Mortgage (P&I)
- −$1,426
- Tax est. 1.5%
- −$340 /mo · $4,080/yr
- Insurance
- −$113
- HOA
- −$0
- Vacancy / Maint / Mgmt
- −$473
- Net cashflow
- $-100
Break-even live
UW: 25.0% down · 7.5% · 30yr · 1.5% tax · 5.0% vac · 8.0% maint · 8.0% mgmt
Financing live
Cash to close
- Down payment
- $67,999
- Closing costs
- $8,160
- Reserves months
- —
- Total cash needed
- —
Loan-product check · same deal, 3 products live
Conventional
25% down · 7.5% · 30yr
- Down + closing
- —
- Monthly P&I
- —
- Monthly cashflow
- —
- DSCR
- —
- Eligible?
- —
Personal DTI + credit; lowest rate.
DSCR
20% down · 8.5% · 30yr
- Down + closing
- —
- Monthly P&I
- —
- Monthly cashflow
- —
- DSCR
- —
- Eligible?
- —
No personal income docs; deal must DSCR.
Hard money
10% down · 12.0% · 12mo
- Down + closing
- —
- Monthly P&I
- —
- Monthly cashflow
- —
- DSCR
- —
- Eligible?
- —
Short-term bridge; refi at stabilization.
Rent comps 2 comps
| Address | Beds | Baths | Sqft | Rent | $/sqft | DOM | Units | Dist |
|---|---|---|---|---|---|---|---|---|
| 152 Iroquois Trl Lexington, NC | 3.0 | 2.5 | 1828 | $2,010 | $1.10 | 14d | 1 | 1.06mi |
| 500 Rylee Ln Lexington, NC | 3.0 | 2.0 | 1200 | $1,550 | $1.29 | 14d | 1 | 1.47mi |
Listing history 18 events
-
2026-06-18days on market $271,997 Active 118 DOM
-
2026-06-17days on market $271,997 Active 117 DOM
-
2026-06-16days on market $271,997 Active 116 DOM
-
2026-06-15days on market $271,997 Active 115 DOM
-
2026-06-14days on market $271,997 Active 113 DOM
-
2026-06-13days on market $271,997 Active 112 DOM
-
2026-06-10days on market $271,997 Active 110 DOM
-
2026-06-09days on market $271,997 Active 109 DOM
-
2026-06-09price $271,997 Active 108 DOM
-
2026-06-08days on market $274,997 Active 108 DOM
-
2026-06-07days on market $274,997 Active 107 DOM
-
2026-06-05days on market $274,997 Active 104 DOM
-
2026-06-03days on market $274,997 Active 103 DOM
-
2026-06-02days on market $274,997 Active 102 DOM
-
2026-06-01days on market $274,997 Active 101 DOM
-
2026-05-31days on market $274,997 Active 100 DOM
-
2026-05-31days on market $274,997 Active 99 DOM
-
2026-02-20$274,997 Active
ⓘ Source: listings_history table (triggers on properties + properties_extension) + one-shot
backfill from property_details.listing_events for pre-trigger history.
Climate risk First Street
- Flood 4/10 Moderate FEMA zone X (unshaded) · 22% chance over 30 yrs
- Wildfire 2/10 Low
- Heat 5/10 Major 7 d/yr ≥103°F today · 16 d/yr by 30 yrs out
- Wind 4/10 Moderate 10% chance of damaging wind over 30 yrs
- Air quality 2/10 Low 1 unhealthy d/yr today · 2 by 30 yrs out
Nearby sold comps map
Loading sold comps map…
Walkable amenities ~0.75 mi
Loading nearby amenities…
Taxation est. · year 1
- Rental income
- $27,033
- − Mortgage interest
- −$15,236
- − Property taxes
- −$4,080
- − Insurance
- −$1,360
- − Repairs & maintenance
- −$2,163
- − Management
- −$2,163
- − Depreciation
- −$7,913
- Taxable loss
- −$5,881
- Est. tax savings @ 24.0%
- +$1,411
- After-tax cash flow
- $211/yr
For passive investors: Depreciation is non-cash, so a rental often shows a tax loss while cash-flowing — sheltering income. Rental losses are passive: they offset passive income freely, and up to $25,000/yr can offset ordinary (W-2) income if you actively participate and your MAGI is under $100k (phasing out to $0 by $150k); unused losses carry forward. On sale, claimed depreciation is recaptured at up to 25%, and gains may owe capital-gains tax (a 1031 exchange can defer both). Figures are a year-1 estimate at your 24.0% rate — not tax advice; consult a CPA.
Schools (NCES district)
- District
- Davidson County Schools
- NCES district ID
- 3701140
- Math proficiency
- 50% ▲ 2.00%
- Reading proficiency
- 50% ▲ 2.00%
- Median HH income
- $49,696
- Composite
- 42.76/100
- National rank
- #3157
- State rank
- #62 of 178 in NC
Livability — Lexington
- Score
- 72/100
- State rank
- #89
- US rank
- #6051
Category grades
Schools grade is shown separately in the Schools card above.
Census & demographics
- County
- Davidson County · 129,088 people
- City population
- 79,578
- Metro
- Winston-Salem, NC
- Population (ZIP)
- 39,267
- Household income
- $63,961
- Rent vs Own
- Severe rent burden
- 733.0
Population outlook (Davidson County) Hauer SSP2
- Today (2025)
- 167,156 people
- By 2030
- 167,216 · +0.0%
- By 2040
- 164,524 · -1.6%
- By 2050
- 157,229 · -5.9%
- By 2075
- 138,084 · -17.4%
- By 2100
- 112,729 · -32.6%
Race, ethnicity, and origin ACS 2023
- Neighborhood character
- Predominantly White (82%)
- Race & ethnicity
- White 82% Hispanic / Latino 6% Black 6% Two or more races 4% Asian 3%
- Hispanic origin (detail)
- Mexican 4%
- Common ancestry
- Serbian 2% Slovak 2% Italian 2%
- Foreign-born
- 5% · Canada, Jamaica
- Languages at home
- 93% English-only · Spanish 5% Other Asian/Pacific 1%
Political lean MEDSL · Davidson
- 2024 margin
- Solid R (+47.1) · D 25.9% · R 73.0% · Other 1.1%
- 2008→2024 swing
- -13.5pp toward R · 2008: -33.5pp · 2024: -47.1pp
- All cycles
- 2024: R+47.1 2020: R+47.5 2016: R+49.4 2012: R+40.9 2008: R+33.5
Not yet ingested
- Civics
- —
Market trends
- HPI YoY
- ▼ -46.39%
- Current HPI
- 258.6557
- Rent YoY
- ▲ 3.37%
- Metro
- Winston-Salem, NC
- State GDP YoY
- ▲ 3.28%
- F500 in state
- 26
Industry mix (Fortune 500 HQ in NC)
| Industry | F500 HQs | Revenue |
|---|---|---|
| Financial Services | 2 | $213B |
|
||
| Retail | 2 | $95B |
|
||
| Industrial Conglomerate | 1 | $38B |
|
||
| Metals / Steel | 1 | $35B |
|
||
| Utilities | 1 | $30B |
|
||
| Industrial Machinery | 1 | $19B |
|
||
Price history
1 event — show timeline
- 2026-02-20 Listed $274,997 Triad MLS
Cash-flow waterfall
monthlySold comps — $/sqft
last 12 mo · ≤1 miLoading sold comps…