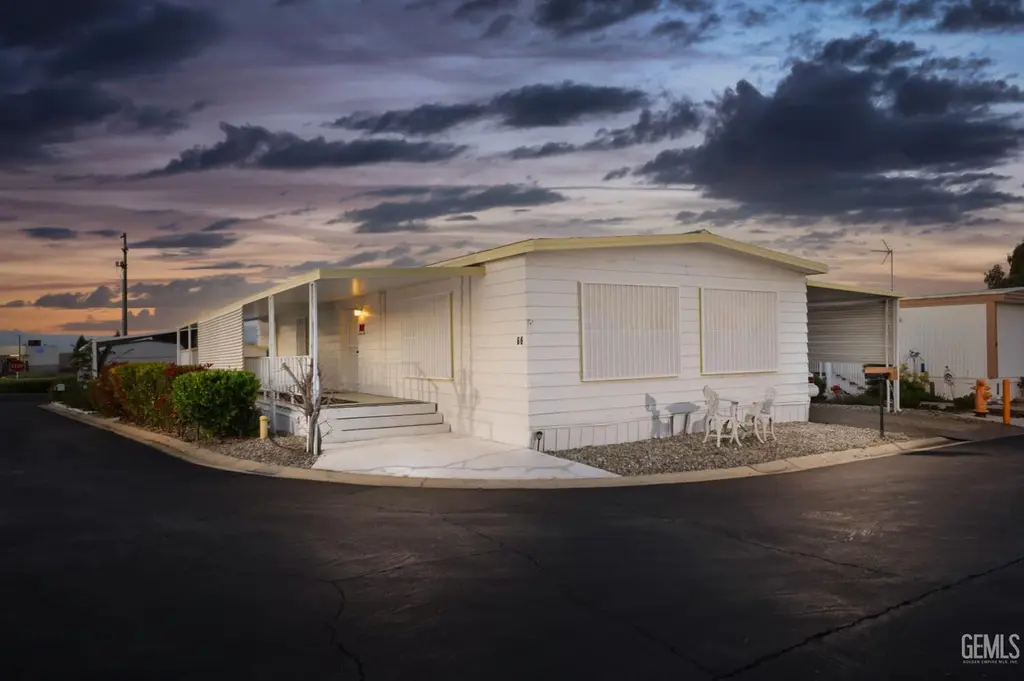
8500 Kern Canyon Rd #66
East Niles, CA 93306
$78,000B+
2 bd · 2.0 ba ·
1,392 sqft ·
Built 1969
· Manufactured
· Active
· 136 DOM
Cashflow @ list (25.0% down · 7.5%)
Estimated rent
$1,654/mo
Mortgage (P&I)
−$409
Tax + insurance
−$81
HOA
−$465
Vac / Maint / Mgmt
−$347
Net cashflow
$351/mo
Annual
$4,215/yr
Cap rate
11.70%
Cash-on-cash
19.30%
DSCR
1.86
1% rule
2.12%
Cash to close
$21,840
Investor read
- This is a 2-bed/2.0-bath manufactured listed at $78k.
- At list price, monthly cash flow is $351 ($4k/yr) — positive.
- The deal already cash-flows at list — no discount required.
- Meets the 1% rule at list price ($2k rent vs $78k).
- It's been on market 136 days — a 12% lower offer ($69k) is reasonable based on typical stale-listing flexibility.
- Recommended offer: $69k (12.0% below list) — sets the bar for market timing.
- Local home prices are declining (-3.0%/yr); year-one equity from $539 of loan paydown is wiped out by about $2k of value loss. Plan a longer hold.
- Location reads: area grade B — affects rentability + tenant quality, not the cash-flow math above.
- Kern High (urban): math 21% / reading 51% proficiency, ranked #860 of 1,400 in CA (top 61%) — families likely to look elsewhere, expect single-tenant / working-renter base with shorter leases.
- Watch-outs: HOA is 28% of rent.
- Market conditions: Rents rising (+2.2%/yr); 387 active listings in the ZIP; 8 comparable units currently listed for rent nearby; rentals leasing fast (median 3d on market — plan ~1-2 weeks tenant-placement turnaround); 3,244 units permitted in Kern County in 2024 (73 in 5+ unit buildings).
- Kern County population projected at +17% by 2050 — long-run rental-demand tailwind backs the buy-and-hold thesis.
- 8 sale attempts since 34y ago with the ask held roughly flat each time — persistent listings suggest the price (not the market) is what's stuck; bring a comps-based counter.
- Current owner paid $55k; 42% above their basis — modest negotiation headroom, anchor on the comps not their cost.
- At projected returns (-3.0% appreciation + 2.2% rent growth), your $22k cash investment doubles in ~7 years — after that, you're playing with house money.
- Climate carrying-cost: major wildfire risk; extreme-heat days projected 4→11/yr by 2055 (HVAC capex compounding) — expect insurance premiums to compound above CPI over the hold.
- Cap rate 11.7% vs local median 4.4% in East Niles — top-decile yield for the area; either an underpriced asset or a hidden risk that comps aren't pricing in. Stress-test before assuming the spread holds.
Questions for listing agent
- It's been on market 136 days. Have you received any prior offers? Is the seller open to a 12% concession, seller financing, or rate buy-down credit?
- Built in 1969 — when were the roof, HVAC, electrical panel, plumbing, and water heater last replaced?
- What does the HOA fee cover, when was the last increase, and are there any pending special assessments or reserve-fund shortfalls?
- Why hasn't it sold? Are there any deal-killer items the seller is aware of (foundation, flood, title, zoning, code violations)?
- Is there a deadline driving the sale (1031 exchange, divorce, estate, relocation)? That informs how much negotiation room exists.
- What's the average days-on-market for RENTAL listings here right now (not sales)? A rising rental-DOM trend means longer vacancies and softer asking-rent achievability than the comps imply.
- What's the recent tenant-quality profile in this submarket — average credit score on applications, eviction rate, late-payment / NSF rate, and stable-employment percentage? A property-management company in the area should have these aggregated.
- How much new for-sale + rental construction is in the pipeline within 1–3 miles? Heavy new supply typically softens prices + rents 12–24 months out; constrained supply supports both.
CashFlowRE · CFR-NAZS7B6XT2SQ48
· Data 2 days ago
cashflowre.app · 2026-05-29