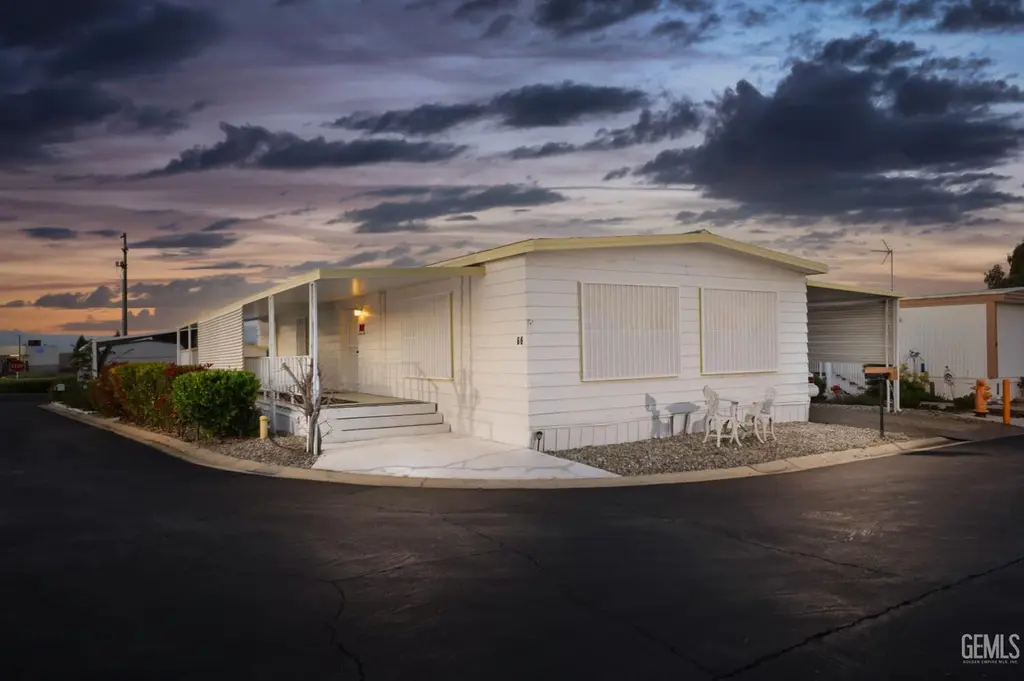
8500 Kern Canyon Rd #66 · East Niles, CA
Flood risk 1/10 · Minimal
- FEMA flood zone
- X (unshaded)
- Chance of flooding over 30 yrs
- 0.0%
- Est. flood insurance / yr
- $507 – $1,088
Fire risk 7/10 · Major
- Est. fire insurance / yr
- $659 – $1,223
Heat risk 8/10 · Major
- Hot days now (above 105°F)
- 4 days/yr
- Hot days in 30 yrs
- 11 days/yr
Wind risk 1/10 · Minimal
- Chance of severe wind over 30 yrs
- —
Air-quality risk 10/10 · Severe
- Unhealthy air days now
- 34 days/yr
- Unhealthy air days in 30 yrs
- 40 days/yr
Risk factors via First Street. Map © Google.
Why this score? — see what drove the B+ grade
The composite is a weighted blend of 9 inputs, each scored 0–100. Each bar is that input's sub-score; the figure is the points it added to the 100-point composite (weight × sub-score).
- Cash flow +30.0/30.0
- ARV discount +15.0/15.0
- 1% rule +10.0/10.0
- DSCR +10.0/10.0
- Schools +3.4/10.0
- Rent growth +3.1/5.0
- Livability +2.5/5.0
- Condition / age +2.5/5.0
- Appreciation +0.0/10.0
$78,000
🖨 Deal sheet (PDF) 📄 Offer letter ✓ Due diligence
Listing remarks MLS
Beautiful mobile home located in the Niles East Mobile Estates 55 + community, very quiet and peaceful. This home is well maintained and cared for by the owner. Home features 2 bedrooms, 2 bathrooms, wood floors throughout, granite kitchen counter tops, upgraded lighting and ceiling fans, a step in shower. This mobile home is handicap assessable. There is also a shed outside perfect for all your personal belongings. Walking distance from the community pool with a spa, and plenty of guest parking. This is perfect and suitable for the next homeowner. A must see to appreciate. Call to schedule your appointment.
Key facts
- Community pool
- Shed outside
- 3,200 sq ft lot
Tags
Neighborhood map
What this means for you Summary
Snapshot
- This is a 2-bed/2.0-bath manufactured listed at $78k.
Deal economics
- At list price, monthly cash flow is $351 ($4k/yr) — positive.
- The deal already cash-flows at list — no discount required.
- Meets the 1% rule at list price ($2k rent vs $78k).
- Recommended offer: $69k (12.0% below list) — sets the bar for market timing.
- Cap rate 11.7% vs local median 4.4% in East Niles — top-decile yield for the area; either an underpriced asset or a hidden risk that comps aren't pricing in. Stress-test before assuming the spread holds.
Location & tenants
- Location reads: area grade B — affects rentability + tenant quality, not the cash-flow math above.
- Kern High (urban): math 21% / reading 51% proficiency, ranked #860 of 1,400 in CA (top 61%) — families likely to look elsewhere, expect single-tenant / working-renter base with shorter leases.
- Market conditions: Rents rising (+2.2%/yr); 387 active listings in the ZIP; 8 comparable units currently listed for rent nearby; rentals leasing fast (median 3d on market — plan ~1-2 weeks tenant-placement turnaround); 3,244 units permitted in Kern County in 2024 (73 in 5+ unit buildings).
Forward outlook
- Local home prices are declining (-3.0%/yr); year-one equity from $539 of loan paydown is wiped out by about $2k of value loss. Plan a longer hold.
- Kern County population projected at +17% by 2050 — long-run rental-demand tailwind backs the buy-and-hold thesis.
- At projected returns (-3.0% appreciation + 2.2% rent growth), your $22k cash investment doubles in ~7 years — after that, you're playing with house money.
Negotiation context
- It's been on market 136 days — a 12% lower offer ($69k) is reasonable based on typical stale-listing flexibility.
- 8 sale attempts since 34y ago with the ask held roughly flat each time — persistent listings suggest the price (not the market) is what's stuck; bring a comps-based counter.
- Current owner paid $55k; 42% above their basis — modest negotiation headroom, anchor on the comps not their cost.
Risks & watch-outs
- Watch-outs: HOA is 28% of rent.
- Climate carrying-cost: major wildfire risk; extreme-heat days projected 4→11/yr by 2055 (HVAC capex compounding) — expect insurance premiums to compound above CPI over the hold.
Questions for the listing agent
- It's been on market 136 days. Have you received any prior offers? Is the seller open to a 12% concession, seller financing, or rate buy-down credit?
- Built in 1969 — when were the roof, HVAC, electrical panel, plumbing, and water heater last replaced?
- What does the HOA fee cover, when was the last increase, and are there any pending special assessments or reserve-fund shortfalls?
- Why hasn't it sold? Are there any deal-killer items the seller is aware of (foundation, flood, title, zoning, code violations)?
- Is there a deadline driving the sale (1031 exchange, divorce, estate, relocation)? That informs how much negotiation room exists.
- What's the average days-on-market for RENTAL listings here right now (not sales)? A rising rental-DOM trend means longer vacancies and softer asking-rent achievability than the comps imply.
- What's the recent tenant-quality profile in this submarket — average credit score on applications, eviction rate, late-payment / NSF rate, and stable-employment percentage? A property-management company in the area should have these aggregated.
- How much new for-sale + rental construction is in the pipeline within 1–3 miles? Heavy new supply typically softens prices + rents 12–24 months out; constrained supply supports both.
Investment metrics
- 1% rule
- 2.12% ✓
- Cap rate
- 11.70%
- Cash-on-cash
- 19.30%
- DSCR
- 1.86
- GRM
- 3.9
CMA / ARV
- ARV (median comp)
- $104,224
- List price
- $78,000
- Delta
- -25.16%
- Verdict
- UNDERPRICED
- Comps
- 20 within 1.0 mi
Show comp detail 12 sales within ~0.75 mi
| Address | Dist | Beds/Ba | Sqft | Sold | Price | $/sf | Match |
|---|---|---|---|---|---|---|---|
| 8500 Kern Canyon Rd #139 | 0.00mi | 2/2.0 | 1,344 (-3%) | 3mo | $74,000 | $55 | 92 |
| 8536 Kern Canyon Rd #73 | 0.18mi | 2/2.0 | 1,440 (+3%) | 2mo | $105,000 | $73 | 84 |
| 8536 Kern Canyon Rd #186 | 0.18mi | 2/2.0 | 1,440 (+3%) | 3mo | $129,900 | $90 | 83 |
| 9108 Eastwind Cir | 0.24mi | 2/2.0 | 1,404 (+1%) | 7mo | $245,000 | $175 | 82 |
| 8536 Kern Canyon Rd #44 | 0.18mi | 2/2.0 | 1,344 (-3%) | 6mo | $63,000 | $47 | 81 |
| 8536 Kern Canyon Rd #136 | 0.18mi | 2/2.0 | 1,430 (+3%) | 8mo | $125,000 | $87 | 81 |
| 8300 Kern Canyon Rd #150 | 0.16mi | 3/2.0 (+1) | 1,344 (-3%) | 1mo | $93,000 | $69 | 80 |
| 8536 Kern Canyon Rd #100 | 0.18mi | 2/2.0 | 1,344 (-3%) | 8mo | $105,000 | $78 | 79 |
| 9305 Eastwind Cir | 0.22mi | 3/2.0 (+1) | 1,344 (-3%) | 6mo | $250,000 | $186 | 74 |
| 8300 Kern Canyon Rd #93 | 0.16mi | 2/2.0 | 1,248 (-10%) | 2mo | $68,000 | $54 | 74 |
| 8536 Kern Canyon Rd #146 | 0.18mi | 2/2.0 | 1,248 (-10%) | 8mo | $85,000 | $68 | 68 |
| 8904 Eastwind Cir | 0.28mi | 2/2.0 | 1,248 (-10%) | 6mo | $285,000 | $228 | 65 |
Match score weights: distance 35% · size 25% · config 20% · recency 20%. Top-matched comps best support the ARV.
Projected returns pro-forma
-3.0% appreciation · 2.24% rent growth · sell at horizon
- IRR
- 10.3%
- Equity multiple
- 1.40×
- Total profit
- $8,758
- Equity at exit
- $11,630
- IRR
- 18.6%
- Equity multiple
- 2.49×
- Total profit
- $32,501
- Equity at exit
- $6,744
Cash invested: $21,840 (down + closing). Projections, not guarantees.
Landlord ↔ Tenant lean methodology
- Overall (STATE)
- 18 Strongly Tenant-Friendly
- State California
- 18 Strongly Tenant-Friendly · D+13
- County
- — inherits STATE
- City
- — inherits STATE
ZIP-level market 93306
- Rents YoY
- 2.2%
- Active inventory
- 387
- Price-to-rent
- 3.9×
Monthly cashflow live
- Estimated rent
- $1,654 high interval (Pro) →
- Mortgage (P&I)
- −$409
- Tax from tax record
- −$49 /mo · $584/yr
- Insurance
- −$32
- HOA
- −$465
- Vacancy / Maint / Mgmt
- −$347
- Net cashflow
- $351
Break-even live
Sensitivity live
| Price | -10% $395 | -5% $373 | +0% $351 | +5% $329 | +10% $307 |
|---|---|---|---|---|---|
| Rent | -10% $221 | -5% $286 | +0% $351 | +5% $417 | +10% $482 |
| Rate | -1.0pp $391 | -0.5pp $371 | base $351 | +0.5pp $331 | +1.0pp $310 |
UW: 25.0% down · 7.5% · 30yr · 1.5% tax · 5.0% vac · 8.0% maint · 8.0% mgmt
Financing live
Cash to close
- Down payment
- $19,500
- Closing costs
- $2,340
- Reserves months
- —
- Total cash needed
- —
Loan-product check · same deal, 3 products live
Conventional
25% down · 7.5% · 30yr
- Down + closing
- —
- Monthly P&I
- —
- Monthly cashflow
- —
- DSCR
- —
- Eligible?
- —
Personal DTI + credit; lowest rate.
DSCR
20% down · 8.5% · 30yr
- Down + closing
- —
- Monthly P&I
- —
- Monthly cashflow
- —
- DSCR
- —
- Eligible?
- —
No personal income docs; deal must DSCR.
Hard money
10% down · 12.0% · 12mo
- Down + closing
- —
- Monthly P&I
- —
- Monthly cashflow
- —
- DSCR
- —
- Eligible?
- —
Short-term bridge; refi at stabilization.
Rent comps 8 comps
| Address | Beds | Baths | Sqft | Rent | $/sqft | DOM | Units | Dist |
|---|---|---|---|---|---|---|---|---|
| 3217 Fortier St Unit B Bakersfield, CA | 3.0 | 2.0 | 1072 | $1,650 | $1.54 | 3d | 1 | 0.42mi |
| 600 Morning Dr Unit 661-363-6434 Bakersfield, CA | 3.0 | 1.0 | 1054 | $1,067 | $1.01 | 44d | 1 | 0.75mi |
| 600 Morning Dr Unit 661-363-6434 Bakersfield, CA | 2.0 | 1.0 | 884 | $1,005 | $1.14 | 3d | 1 | 0.75mi |
| 7000 College Ave Apt 168 Bakersfield, CA | 2.0 | 2.0 | 957 | $1,655 | $1.73 | 19d | 1 | 0.97mi |
| 8817 Butternut Ave Bakersfield, CA | 3.0 | 2.0 | 1383 | $2,200 | $1.59 | 3d | 1 | 0.98mi |
| 9802 Krista Vineyard Way Bakersfield, CA | 3.0 | 2.0 | 1300 | $2,195 | $1.69 | 3d | 1 | 1.40mi |
| 6900 Valleyview Dr Apt 127 Bakersfield, CA | 2.0 | 1.5 | 975 | $1,535 | $1.57 | 44d | 1 | 1.49mi |
| 6900 Valleyview Dr Unit 152 Bakersfield, CA | 2.0 | 2.0 | 1040 | $1,610 | $1.55 | 3d | 1 | 1.49mi |
HOA detail
- Monthly dues
- $465 · $5,580/yr
- Likely covers
- pool
Listing history 37 events
-
2026-06-18days on market $78,000 Active 136 DOM
-
2026-06-17days on market $78,000 Active 135 DOM
-
2026-06-16days on market $78,000 Active 134 DOM
-
2026-06-15days on market $78,000 Active 133 DOM
-
2026-06-14days on market $78,000 Active 131 DOM
-
2026-06-10days on market $78,000 Active 128 DOM
-
2026-06-09days on market $78,000 Active 127 DOM
-
2026-06-08days on market $78,000 Active 126 DOM
-
2026-06-07days on market $78,000 Active 125 DOM
-
2026-06-05days on market $78,000 Active 122 DOM
-
2026-06-03days on market $78,000 Active 121 DOM
-
2026-06-03days on market $78,000 Active 120 DOM
-
2026-06-01days on market $78,000 Active 119 DOM
-
2026-05-31days on market $78,000 Active 118 DOM
-
2026-02-02$78,000 Active 615-char remark
Show marketing remark (615 chars)
Beautiful mobile home located in the Niles East Mobile Estates 55 + community, very quiet and peaceful. This home is well maintained and cared for by the owner. Home features 2 bedrooms, 2 bathrooms, wood floors throughout, granite kitchen counter tops, upgraded lighting and ceiling fans, a step in shower. This mobile home is handicap assessable. There is also a shed outside perfect for all your personal belongings. Walking distance from the community pool with a spa, and plenty of guest parking. This is perfect and suitable for the next homeowner. A must see to appreciate. Call to schedule your appointment.
-
2025-09-04price $78,000
-
2025-05-14status Active
-
2025-03-13status Pending
-
2024-12-02$85,500 Active
-
2024-05-29$85,500 Active
-
2024-05-10price $85,500
-
2024-05-01price $99,999
-
2021-02-23soldstatus $55,000 Sold
-
2021-02-23soldstatus $55,000 Closed Sale
-
2021-02-09status Pending Sale
-
2021-02-08status Pending
-
2021-02-04historical Active - Contingent
-
2020-12-08$55,000 Active
-
2020-12-01$55,000 Active
-
1999-09-14soldstatus $17,000
-
1999-09-02historical
-
1999-09-02price $19,000
-
1999-08-26$17,000
-
1993-02-04soldstatus $20,000
-
1992-12-07historical
-
1992-12-07price $22,000
-
1992-10-30$20,000
ⓘ Source: listings_history table (triggers on properties + properties_extension) + one-shot
backfill from property_details.listing_events for pre-trigger history.
Tax reassessment forecast CA · Resets to sale price
- Current annual tax
- $584 · $49/mo
- Projected year-2 tax
- $593 · $49/mo
- Expected delta
- +$9/yr (+$1/mo · 1.5%)
ⓘ Screening estimate from a state-policy table — verify with the county assessor before closing.
Climate risk First Street
- Flood 1/10 Low FEMA zone X (unshaded) · 0% chance over 30 yrs
- Wildfire 7/10 Severe
- Heat 8/10 Severe 4 d/yr ≥105°F today · 11 d/yr by 30 yrs out
- Wind 1/10 Low
- Air quality 10/10 Extreme 34 unhealthy d/yr today · 40 by 30 yrs out
Nearby sold comps map
Loading sold comps map…
Walkable amenities ~0.75 mi
Loading nearby amenities…
Taxation est. · year 1
- Rental income
- $19,845
- − Mortgage interest
- −$4,369
- − Property taxes
- −$584
- − Insurance
- −$390
- − Repairs & maintenance
- −$1,588
- − Management
- −$1,588
- − HOA
- −$5,580
- − Depreciation
- −$2,269
- Taxable income
- $3,477
- Est. tax owed @ 24.0%
- −$835
- After-tax cash flow
- $3,380/yr
For passive investors: Depreciation is non-cash, so a rental often shows a tax loss while cash-flowing — sheltering income. Rental losses are passive: they offset passive income freely, and up to $25,000/yr can offset ordinary (W-2) income if you actively participate and your MAGI is under $100k (phasing out to $0 by $150k); unused losses carry forward. On sale, claimed depreciation is recaptured at up to 25%, and gains may owe capital-gains tax (a 1031 exchange can defer both). Figures are a year-1 estimate at your 24.0% rate — not tax advice; consult a CPA.
Schools (NCES district)
- District
- Kern High
- NCES district ID
- 0619540
- Math proficiency
- 21% ▬ 0.00%
- Reading proficiency
- 51% ▲ 2.00%
- Median HH income
- $49,686
- Composite
- 33.68/100
- National rank
- #10443
- State rank
- #860 of 1400 in CA
Livability — East Niles
No livability data for this city. (Only ~50 U.S. cities are tracked.)
Census & demographics
- Census place
- East Niles, CA
- County
- Kern County · 710,371 people
- Metro
- Bakersfield, CA
- Population (ZIP)
- 74,116
- Household income
- $69,805
- Rent vs Own
- Severe rent burden
- 2871.0
Population outlook (Kern County) Hauer SSP2
- Today (2025)
- 947,286 people
- By 2030
- 978,984 · +3.3%
- By 2040
- 1,045,018 · +10.3%
- By 2050
- 1,105,232 · +16.7%
- By 2075
- 1,229,538 · +29.8%
- By 2100
- 1,238,059 · +30.7%
Race, ethnicity, and origin ACS 2023
- Neighborhood character
- Predominantly Hispanic (67%)
- Race & ethnicity
- Hispanic / Latino 67% White 23% Two or more races 20% Black 3% Asian 2% Native American 1%
- Hispanic origin (detail)
- Mexican 63%
- Common ancestry
- Italian 2% Slovak 1% Russian 1%
- Foreign-born
- 19% · Canada
- Languages at home
- 50% English-only · Spanish 46% Other Asian/Pacific 1% Arabic 1%
Political lean MEDSL · Kern
- 2024 margin
- Strong R (+21.1) · D 38.2% · R 59.3% · Other 2.5%
- 2008→2024 swing
- -3.3pp toward R · 2008: -17.8pp · 2024: -21.1pp
- All cycles
- 2024: R+21.1 2020: R+10.2 2016: R+15.0 2012: R+20.9 2008: R+17.8
Not yet ingested
- Civics
- —
Market trends
- HPI YoY
- ▼ -323.02%
- Current HPI
- 358.5434
- Rent YoY
- ▲ 2.24%
- Metro
- Bakersfield, CA
- State GDP YoY
- ▲ 3.21%
- F500 in state
- 116
Industry mix (Fortune 500 HQ in CA)
| Industry | F500 HQs | Revenue |
|---|---|---|
| Technology | 27 | $1,492B |
|
||
| Financial Services | 3 | $174B |
|
||
| Retail | 3 | $44B |
|
||
| Insurance | 3 | $26B |
|
||
| Media / Entertainment | 2 | $115B |
|
||
| Pharmaceuticals / Biotech | 2 | $62B |
|
||
Price history
+290.0% since first listed23 events — show timeline
- 2026-02-02 Listed $78,000 GEMLS
- 2025-09-04 Price Changed $78,000 GEMLS
- 2025-05-14 Relisted — GEMLS
- 2025-03-13 Pending — GEMLS
- 2024-12-02 Listed $85,500 GEMLS
- 2024-05-29 Listed $85,500 GEMLS
- 2024-05-10 Price Changed $85,500 GEMLS
- 2024-05-01 Price Changed $99,999 GEMLS
- 2021-02-23 Sold (MLS) $55,000 CRMLS
- 2021-02-23 Sold (MLS) $55,000 GEMLS
- 2021-02-09 Pending — CRMLS
- 2021-02-08 Pending — GEMLS
- 2021-02-04 Contingent — GEMLS
- 2020-12-08 Listed $55,000 CRMLS
- 2020-12-01 Listed $55,000 GEMLS
- 1999-09-14 Sold (MLS) $17,000 GEMLS
- 1999-09-02 Price Changed $19,000 GEMLS
- 1999-09-02 Delisted — GEMLS
- 1999-08-26 Listed $17,000 GEMLS
- 1993-02-04 Sold (MLS) $20,000 GEMLS
- 1992-12-07 Price Changed $22,000 GEMLS
- 1992-12-07 Delisted — GEMLS
- 1992-10-30 Listed $20,000 GEMLS
Property tax history
+10.1%/yrLatest (2025): $584 · +4.9% YoY. Source: county tax records.
Cash-flow waterfall
monthlySold comps — $/sqft
last 12 mo · ≤1 miLoading sold comps…