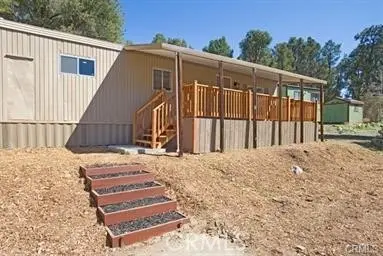
2820 Polar Way
Pine Mountain Club, CA 93225
$219,000D
2 bd · 1.0 ba ·
780 sqft ·
Built 1974
· SingleFamily
· Active
· 151 DOM
Cashflow @ list (25.0% down · 7.5%)
Estimated rent
$1,858/mo
Mortgage (P&I)
−$1,148
Tax + insurance
−$192
HOA
−$165
Vac / Maint / Mgmt
−$390
Net cashflow
$-38/mo
Annual
$-452/yr
Cap rate
6.09%
Cash-on-cash
-0.74%
DSCR
0.97
1% rule
0.85%
Cash to close
$61,320
Investor read
- This is a 2-bed/1.0-bath single-family listed at $219k.
- At list price, monthly cash flow is $-38 ($-452/yr) — negative.
- To cash-flow at today's rent, offer at most $212k (3.0% below list).
- To meet the 1% rule (rent ≥ 1% of price), the offer needs to be $186k (15.2% below list).
- It's been on market 151 days — a 12% lower offer ($193k) is reasonable based on typical stale-listing flexibility.
- Recommended offer: $186k (15.2% below list) — sets the bar for 1% rule.
- Local home prices are declining (-3.0%/yr); year-one equity from $2k of loan paydown is wiped out by about $7k of value loss. Plan a longer hold.
- Location reads 51/100 on livability (#1,081 in CA) — a working-class tenant base; expect higher turnover. Strengths: housing A, crime A-; Watch: amenities F, commute F, cost of living F.
- Maricopa Unified (rural): math 10% / reading 20% proficiency, ranked #1,302 of 1,400 in CA (top 93%) — low school quality limits family demand, transient renter base, plan for 1-2y turnover.
- Zoned schools: Maricopa Elementary (math 8% / reading 17%, grade F, #1,477 of 1,571 statewide, top 94%, 157 students, 98% FRL); Maricopa Middle (math 8% / reading 22%, grade F, #461 of 498 statewide, top 93%, 77 students, 96% FRL); Maricopa High (math 10% / reading 10%, grade F, #1,064 of 1,170 statewide, top 97%, 84 students, 96% FRL) — zoned schools average 97% FRL vs 55% district-wide (42 pts higher); higher-poverty schools than district average — tighter screening recommended.
- Market conditions: 125 active listings in the ZIP; 2 comparable units currently listed for rent nearby; 3,244 units permitted in Kern County in 2024 (73 in 5+ unit buildings).
- Kern County population projected at +17% by 2050 — long-run rental-demand tailwind backs the buy-and-hold thesis.
- 15 sale attempts since 5y ago with the ask held roughly flat each time — persistent listings suggest the price (not the market) is what's stuck; bring a comps-based counter.
- Current owner paid $85k; list at $219k implies a 158% gain — meaningful room to come down on a strong offer.
- Climate carrying-cost: severe wildfire risk — expect insurance premiums to compound above CPI over the hold.
- Cap rate 6.1% vs local median 3.1% in Pine Mountain Club — top-decile yield for the area; either an underpriced asset or a hidden risk that comps aren't pricing in. Stress-test before assuming the spread holds.
Questions for listing agent
- What do current leases actually rent for vs. the listed asking? Can we see a recent rent roll and the last 12 months of T-12 income?
- It's been on market 151 days. Have you received any prior offers? Is the seller open to a 15% concession, seller financing, or rate buy-down credit?
- Built in 1974 — when were the roof, HVAC, electrical panel, plumbing, and water heater last replaced?
- What does the HOA fee cover, when was the last increase, and are there any pending special assessments or reserve-fund shortfalls?
- Why hasn't it sold? Are there any deal-killer items the seller is aware of (foundation, flood, title, zoning, code violations)?
- Is there a deadline driving the sale (1031 exchange, divorce, estate, relocation)? That informs how much negotiation room exists.
- The area grade is low — what's the realistic commute time and amenity access for the typical tenant pool here? Any planned neighborhood developments (good or bad) we should know about?
- What's the average days-on-market for RENTAL listings here right now (not sales)? A rising rental-DOM trend means longer vacancies and softer asking-rent achievability than the comps imply.
CashFlowRE · CFR-NDPR9087X5YA05
· Data 1 day ago
cashflowre.app · 2026-05-29