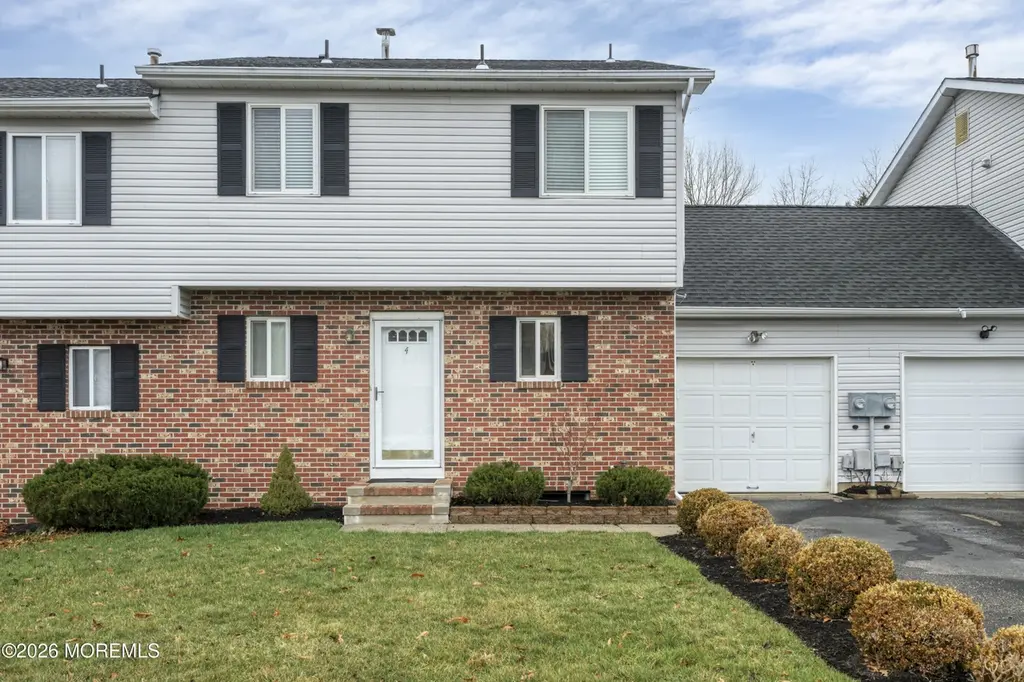
4 Osprey Ct
Ramtown, NJ 07731
$399,000D-
3 bd · 1.5 ba ·
1,320 sqft ·
Built 1994
· Townhouse
· Pending
· 12 DOM
Cashflow @ list (25.0% down · 7.5%)
Estimated rent
$3,316/mo
Mortgage (P&I)
−$2,092
Tax + insurance
−$767
HOA
−$121
Vac / Maint / Mgmt
−$696
Net cashflow
$-361/mo
Annual
$-4,330/yr
Cap rate
5.21%
Cash-on-cash
-3.88%
DSCR
0.83
1% rule
0.83%
Cash to close
$111,720
Investor read
- This is a 3-bed/1.5-bath townhouse listed at $399k.
- At list price, monthly cash flow is $-361 ($-4k/yr) — negative.
- To cash-flow at today's rent, offer at most $335k (16.0% below list).
- To meet the 1% rule (rent ≥ 1% of price), the offer needs to be $332k (16.9% below list).
- Only 12 days on market — expect competitive offers; lowballing is unlikely to land.
- Recommended offer: $332k (16.9% below list) — sets the bar for 1% rule.
- Local home prices are declining (-3.0%/yr); year-one equity from $3k of loan paydown is wiped out by about $12k of value loss. Plan a longer hold.
- Location reads 69/100 on livability (#280 in NJ) — a middle-class / working-renter tenant base. Strengths: employment A+, housing A+, schools A; Watch: amenities F, commute F, cost of living F.
- Howell Township Public School District (suburban): math 30% / reading 52% proficiency, ranked #195 of 472 in NJ (top 41%) — families likely to look elsewhere, expect single-tenant / working-renter base with shorter leases; only 12% free/reduced lunch — higher-income household profile.
- Market conditions: Rents rising (+1.5%/yr); 331 active listings in the ZIP; high-income renter base; 2,840 units permitted in Monmouth County in 2024 (484 in 5+ unit buildings).
- Monmouth County population projected at -11% by 2050 — secular population decline; favor cash flow + early exit over multi-decade hold.
- 2 sale attempts since 13y ago with the ask held roughly flat each time — persistent listings suggest the price (not the market) is what's stuck; bring a comps-based counter.
- Current owner paid $220k; list at $399k implies a 81% gain — meaningful room to come down on a strong offer.
- Climate carrying-cost: severe wind risk, 80% chance of damaging wind over 30y; extreme-heat days projected 7→15/yr by 2055 (HVAC capex compounding) — expect insurance premiums to compound above CPI over the hold.
- Cap rate 5.2% vs local median 2.8% in Ramtown — top-decile yield for the area; either an underpriced asset or a hidden risk that comps aren't pricing in. Stress-test before assuming the spread holds.
Questions for listing agent
- What do current leases actually rent for vs. the listed asking? Can we see a recent rent roll and the last 12 months of T-12 income?
- What does the HOA fee cover, when was the last increase, and are there any pending special assessments or reserve-fund shortfalls?
- Is there a deadline driving the sale (1031 exchange, divorce, estate, relocation)? That informs how much negotiation room exists.
- Schools are A-rated — typically a magnet for longer-tenancy family renters. What's the average tenant stay here, and is there a school-zone premium baked into asking?
- The area grade is low — what's the realistic commute time and amenity access for the typical tenant pool here? Any planned neighborhood developments (good or bad) we should know about?
- What's the average days-on-market for RENTAL listings here right now (not sales)? A rising rental-DOM trend means longer vacancies and softer asking-rent achievability than the comps imply.
- What's the recent tenant-quality profile in this submarket — average credit score on applications, eviction rate, late-payment / NSF rate, and stable-employment percentage? A property-management company in the area should have these aggregated.
- How much new for-sale + rental construction is in the pipeline within 1–3 miles? Heavy new supply typically softens prices + rents 12–24 months out; constrained supply supports both.
CashFlowRE · CFR-NDV2R6AMEREQAW
· Data 1 week ago
cashflowre.app · 2026-05-29