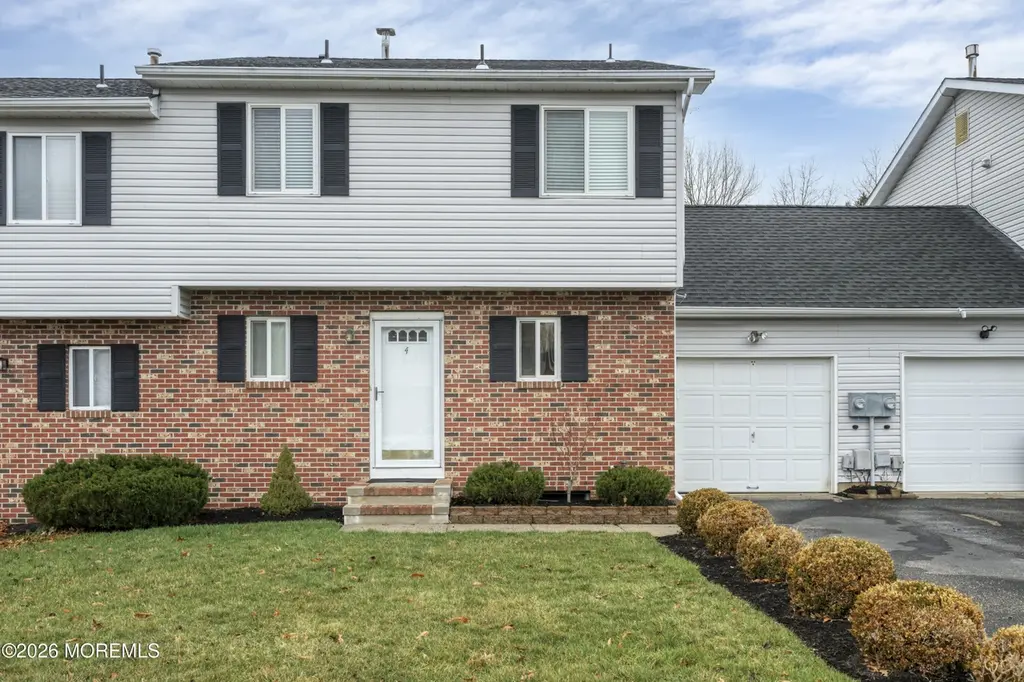
4 Osprey Ct · Ramtown, NJ
Flood risk 1/10 · Minimal
- FEMA flood zone
- X (unshaded)
- Chance of flooding over 30 yrs
- 0.0%
- Est. flood insurance / yr
- $473 – $860
Fire risk 3/10 · Minor
- Est. fire insurance / yr
- $526 – $976
Heat risk 7/10 · Major
- Hot days now (above 101°F)
- 7 days/yr
- Hot days in 30 yrs
- 15 days/yr
Wind risk 8/10 · Major
- Chance of severe wind over 30 yrs
- 80.0%
Air-quality risk 3/10 · Minor
- Unhealthy air days now
- 3 days/yr
- Unhealthy air days in 30 yrs
- 5 days/yr
Risk factors via First Street. Map © Google.
Why this score? — see what drove the D- grade
The composite is a weighted blend of 9 inputs, each scored 0–100. Each bar is that input's sub-score; the figure is the points it added to the 100-point composite (weight × sub-score).
- ARV discount +11.3/15.0
- Cash flow +8.4/30.0
- Schools +3.9/10.0
- Livability +3.5/5.0
- 1% rule +3.3/10.0
- Rent growth +2.9/5.0
- Condition / age +2.5/5.0
- DSCR +2.3/10.0
- Appreciation +0.0/10.0
$399,000
🖨 Deal sheet 📄 Offer letter ✓ Due diligence
Listing remarks MLS
Don't miss this 3 bedroom 1 1/2 bath townhouse in Briar Crest. All you have to do is unpack! Sliders from the dining room leading to the deck in the fenced in private backyard. Full basement great for storage space. Garage has a direct entry into the laundry room. Low maintenance fees! This is a great opportunity!
Key facts
- $121 HOA
- Garage
- Built 1994
Property features AI
Finance
- HOA & community: Monthly association fee of $121.27; Association covers common area maintenance and snow removal; Briarcrest East Association
Exterior
- Parking: Attached 1-car garage
- Utilities: Public sewer
- Home design: Attached property
- Exterior features: Shingle roof
Interior
- Bedrooms: 3 bedrooms
- Flooring: Wood
- Bathrooms: 1 full bathroom and 1 half bathroom (1.5 total)
- Heating & cooling: Forced air heating; Central air conditioning
- Interior features: Wood flooring; Heated basement
Neighborhood map
What this means for you Summary
Snapshot
- This is a 3-bed/1.5-bath townhouse listed at $399k.
Deal economics
- At list price, monthly cash flow is $-361 ($-4k/yr) — negative.
- To cash-flow at today's rent, offer at most $335k (16.0% below list).
- To meet the 1% rule (rent ≥ 1% of price), the offer needs to be $332k (16.9% below list).
- Recommended offer: $332k (16.9% below list) — sets the bar for 1% rule.
- Cap rate 5.2% vs local median 2.8% in Ramtown — top-decile yield for the area; either an underpriced asset or a hidden risk that comps aren't pricing in. Stress-test before assuming the spread holds.
Location & tenants
- Location reads 69/100 on livability (#280 in NJ) — a middle-class / working-renter tenant base. Strengths: employment A+, housing A+, schools A; Watch: amenities F, commute F, cost of living F.
- Howell Township Public School District (suburban): math 30% / reading 52% proficiency, ranked #195 of 472 in NJ (top 41%) — families likely to look elsewhere, expect single-tenant / working-renter base with shorter leases; only 12% free/reduced lunch — higher-income household profile.
- Market conditions: Rents rising (+1.5%/yr); 331 active listings in the ZIP; high-income renter base; 2,840 units permitted in Monmouth County in 2024 (484 in 5+ unit buildings).
Forward outlook
- Local home prices are declining (-3.0%/yr); year-one equity from $3k of loan paydown is wiped out by about $12k of value loss. Plan a longer hold.
- Monmouth County population projected at -11% by 2050 — secular population decline; favor cash flow + early exit over multi-decade hold.
Negotiation context
- Only 12 days on market — expect competitive offers; lowballing is unlikely to land.
- 2 sale attempts since 13y ago with the ask held roughly flat each time — persistent listings suggest the price (not the market) is what's stuck; bring a comps-based counter.
- Current owner paid $220k; list at $399k implies a 81% gain — meaningful room to come down on a strong offer.
Risks & watch-outs
- Climate carrying-cost: severe wind risk, 80% chance of damaging wind over 30y; extreme-heat days projected 7→15/yr by 2055 (HVAC capex compounding) — expect insurance premiums to compound above CPI over the hold.
Questions for the listing agent
- What do current leases actually rent for vs. the listed asking? Can we see a recent rent roll and the last 12 months of T-12 income?
- What does the HOA fee cover, when was the last increase, and are there any pending special assessments or reserve-fund shortfalls?
- Is there a deadline driving the sale (1031 exchange, divorce, estate, relocation)? That informs how much negotiation room exists.
- Schools are A-rated — typically a magnet for longer-tenancy family renters. What's the average tenant stay here, and is there a school-zone premium baked into asking?
- The area grade is low — what's the realistic commute time and amenity access for the typical tenant pool here? Any planned neighborhood developments (good or bad) we should know about?
- What's the average days-on-market for RENTAL listings here right now (not sales)? A rising rental-DOM trend means longer vacancies and softer asking-rent achievability than the comps imply.
- What's the recent tenant-quality profile in this submarket — average credit score on applications, eviction rate, late-payment / NSF rate, and stable-employment percentage? A property-management company in the area should have these aggregated.
- How much new for-sale + rental construction is in the pipeline within 1–3 miles? Heavy new supply typically softens prices + rents 12–24 months out; constrained supply supports both.
Investment metrics
- 1% rule
- 0.83% ✗
- Cap rate
- 5.21%
- Cash-on-cash
- -3.88%
- DSCR
- 0.83
- GRM
- 10.0
CMA / ARV
- ARV (on-the-fly)
- $435,600
- Comps found
- 9
Show comp detail 9 sales within ~0.75 mi
| Address | Dist | Beds/Ba | Sqft | Sold | Price | $/sf | Match |
|---|---|---|---|---|---|---|---|
| 6 Osprey Ct | 0.00mi | 3/1.5 | 1,320 (0%) | 11mo | $456,000 | $345 | 91 |
| 7 Tracey Ct | 0.55mi | 3/1.5 | 1,320 (0%) | 1mo | $435,000 | $330 | 74 |
| 11 Desiree Ct | 0.20mi | 3/1.5 | 1,452 (+10%) | 7mo | $448,000 | $309 | 68 |
| 10 Elizabeth Ct | 0.35mi | 3/1.5 | 1,320 (0%) | 18mo | $375,000 | $284 | 68 |
| 10 Tracey Ct | 0.54mi | 3/1.5 | 1,320 (0%) | 12mo | $450,000 | $341 | 65 |
| 3 Tracey Ct | 0.52mi | 3/1.5 | 1,320 (0%) | 17mo | $405,000 | $307 | 62 |
| 9 Desiree Ct | 0.19mi | 3/1.5 | 1,200 (-9%) | 22mo | $360,000 | $300 | 58 |
| 5 Tracey Ct | 0.54mi | 3/1.5 | 1,200 (-9%) | 18mo | $418,000 | $348 | 44 |
| 8 Colleen Ct | 0.47mi | 3/1.5 | 1,200 (-9%) | 23mo | $396,000 | $330 | 43 |
Match score weights: distance 35% · size 25% · config 20% · recency 20%. Top-matched comps best support the ARV.
Projected returns pro-forma
-3.0% appreciation · 1.52% rent growth · sell at horizon
- IRR
- -24.6%
- Equity multiple
- 0.17×
- Total profit
- $-92,317
- Equity at exit
- $59,492
- IRR
- -25.4%
- Equity multiple
- -0.15×
- Total profit
- $-128,604
- Equity at exit
- $34,498
Cash invested: $111,720 (down + closing). Projections, not guarantees.
Landlord ↔ Tenant lean methodology
- Overall (STATE)
- 21 Tenant-Leaning
- State New Jersey
- 21 Tenant-Leaning · D+6
- County
- — inherits STATE
- City
- — inherits STATE
ZIP-level market 07731
- Rents YoY
- 1.5%
- Active inventory
- 331
- Price-to-rent
- 10.0×
Monthly cashflow live
- Estimated rent
- $3,316 medium interval (Pro) →
- Mortgage (P&I)
- −$2,092
- Tax from tax record
- −$601 /mo · $7,209/yr
- Insurance
- −$166
- HOA
- −$121
- Vacancy / Maint / Mgmt
- −$696
- Net cashflow
- $-361
Break-even live
UW: 25.0% down · 7.5% · 30yr · 1.5% tax · 5.0% vac · 8.0% maint · 8.0% mgmt
Financing live
Cash to close
- Down payment
- $99,750
- Closing costs
- $11,970
- Reserves months
- —
- Total cash needed
- —
Loan-product check · same deal, 3 products live
Conventional
25% down · 7.5% · 30yr
- Down + closing
- —
- Monthly P&I
- —
- Monthly cashflow
- —
- DSCR
- —
- Eligible?
- —
Personal DTI + credit; lowest rate.
DSCR
20% down · 8.5% · 30yr
- Down + closing
- —
- Monthly P&I
- —
- Monthly cashflow
- —
- DSCR
- —
- Eligible?
- —
No personal income docs; deal must DSCR.
Hard money
10% down · 12.0% · 12mo
- Down + closing
- —
- Monthly P&I
- —
- Monthly cashflow
- —
- DSCR
- —
- Eligible?
- —
Short-term bridge; refi at stabilization.
HOA detail
- Monthly dues
- $121 · $1,452/yr
Listing history 8 events
-
2026-04-30status Pending
-
2026-04-18$399,000 Active
-
2026-04-16historical $399,000
-
2013-10-22soldstatus $220,000
-
2013-10-15soldstatus $220,000 315-char remark
Show marketing remark (315 chars)
Don't miss this 3 bedroom 1 1/2 bath townhouse in Briar Crest. All you have to do is unpack! Sliders from the dining room leading to the deck in the fenced in private backyard. Full basement great for storage space. Garage has a direct entry into the laundry room. Low maintenance fees! This is a great opportunity!
-
2013-06-15$225,000 315-char remark
Show marketing remark (315 chars)
Don't miss this 3 bedroom 1 1/2 bath townhouse in Briar Crest. All you have to do is unpack! Sliders from the dining room leading to the deck in the fenced in private backyard. Full basement great for storage space. Garage has a direct entry into the laundry room. Low maintenance fees! This is a great opportunity!
-
1999-03-02soldstatus $105,000
-
1994-01-25soldstatus $82,900
ⓘ Source: listings_history table (triggers on properties + properties_extension) + one-shot
backfill from property_details.listing_events for pre-trigger history.
Tax reassessment forecast NJ · Partial reset (capped growth)
- Current annual tax
- $7,209 · $601/mo
- Projected year-2 tax
- $8,572 · $714/mo
- Expected delta
- +$1,363/yr (+$114/mo · 18.9%)
ⓘ Screening estimate from a state-policy table — verify with the county assessor before closing.
Climate risk First Street
- Flood 1/10 Low FEMA zone X (unshaded) · 0% chance over 30 yrs
- Wildfire 3/10 Moderate
- Heat 7/10 Severe 7 d/yr ≥101°F today · 15 d/yr by 30 yrs out
- Wind 8/10 Severe 80% chance of damaging wind over 30 yrs
- Air quality 3/10 Moderate 3 unhealthy d/yr today · 5 by 30 yrs out
Nearby sold comps map
Loading sold comps map…
Walkable amenities ~0.75 mi
Loading nearby amenities…
Taxation est. · year 1
- Rental income
- $39,791
- − Mortgage interest
- −$22,350
- − Property taxes
- −$7,209
- − Insurance
- −$1,995
- − Repairs & maintenance
- −$3,183
- − Management
- −$3,183
- − HOA
- −$1,452
- − Depreciation
- −$11,607
- Taxable loss
- −$11,189
- Est. tax savings @ 24.0%
- +$2,685
- After-tax cash flow
- $-1,645/yr
For passive investors: Depreciation is non-cash, so a rental often shows a tax loss while cash-flowing — sheltering income. Rental losses are passive: they offset passive income freely, and up to $25,000/yr can offset ordinary (W-2) income if you actively participate and your MAGI is under $100k (phasing out to $0 by $150k); unused losses carry forward. On sale, claimed depreciation is recaptured at up to 25%, and gains may owe capital-gains tax (a 1031 exchange can defer both). Figures are a year-1 estimate at your 24.0% rate — not tax advice; consult a CPA.
Schools (NCES district)
- District
- Howell Township Public School District
- NCES district ID
- 3407560
- Math proficiency
- 30% ▼ -26.00%
- Reading proficiency
- 52% ▼ -16.00%
- Median HH income
- $93,085
- Composite
- 39.35/100
- National rank
- #3979
- State rank
- #195 of 472 in NJ
Livability — Ramtown
- Score
- 69/100
- State rank
- #280
- US rank
- #8309
Category grades
Schools grade is shown separately in the Schools card above.
Census & demographics
- Census place
- Ramtown, NJ
- County
- Monmouth County · 505,557 people
- Metro
- New York-Newark-Jersey City, NY-NJ-PA
- Population (ZIP)
- 40,322
- Household income
- $134,056
- Rent vs Own
- Severe rent burden
- 590.0
Population outlook (Monmouth County) Hauer SSP2
- Today (2025)
- 620,308 people
- By 2030
- 612,309 · -1.3%
- By 2040
- 587,297 · -5.3%
- By 2050
- 551,342 · -11.1%
- By 2075
- 472,934 · -23.8%
- By 2100
- 381,534 · -38.5%
Race, ethnicity, and origin ACS 2023
- Neighborhood character
- Predominantly White (73%)
- Race & ethnicity
- White 73% Hispanic / Latino 16% Two or more races 10% Black 4% Asian 3%
- Hispanic origin (detail)
- Mexican 3% Puerto Rican 5% Cuban 1% Dominican 2%
- Common ancestry
- Romanian 6% Scotch-Irish 2% Lithuanian 1%
- Foreign-born
- 13% · Canada, Jamaica, China
- Languages at home
- 83% English-only · Spanish 10% Other Indo-European 2% Russian/Polish/Slavic 2%
Political lean MEDSL · Monmouth
- 2024 margin
- R (+11.4) · D 43.4% · R 54.8% · Other 1.8%
- 2008→2024 swing
- -7.7pp toward R · 2008: -3.7pp · 2024: -11.4pp
- All cycles
- 2024: R+11.4 2020: R+2.8 2016: R+9.5 2012: R+5.5 2008: R+3.7
Not yet ingested
- Civics
- —
Market trends
- HPI YoY
- ▼ -303.76%
- Current HPI
- 375.492
- Rent YoY
- ▲ 1.52%
- Metro
- New York-Newark-Jersey City, NY-NJ-PA
- State GDP YoY
- ▲ 2.05%
- F500 in state
- 34
Industry mix (Fortune 500 HQ in NJ)
| Industry | F500 HQs | Revenue |
|---|---|---|
| Consumer Goods | 3 | $31B |
|
||
| Pharmaceuticals | 2 | $153B |
|
||
| Technology | 2 | $21B |
|
||
| Insurance | 2 | $20B |
|
||
| Healthcare | 2 | $19B |
|
||
| Financial Services | 1 | $70B |
|
||
Price history
+381.3% since first listed8 events — show timeline
- 2026-04-30 Pending — MOMLS
- 2026-04-18 Listed $399,000 MOMLS
- 2026-04-16 Coming Soon $399,000 MOMLS
- 2013-10-22 Sold (Public Records) $220,000 Public Records
- 2013-10-15 Sold (MLS) $220,000 MOMLS
- 2013-06-15 Listed $225,000 MOMLS
- 1999-03-02 Sold (Public Records) $105,000 Public Records
- 1994-01-25 Sold (Public Records) $82,900 Public Records
Property tax history
+1.7%/yrLatest (2025): $7,209 · +8.8% YoY. Source: county tax records.
Cash-flow waterfall
monthlySold comps — $/sqft
last 12 mo · ≤1 miLoading sold comps…