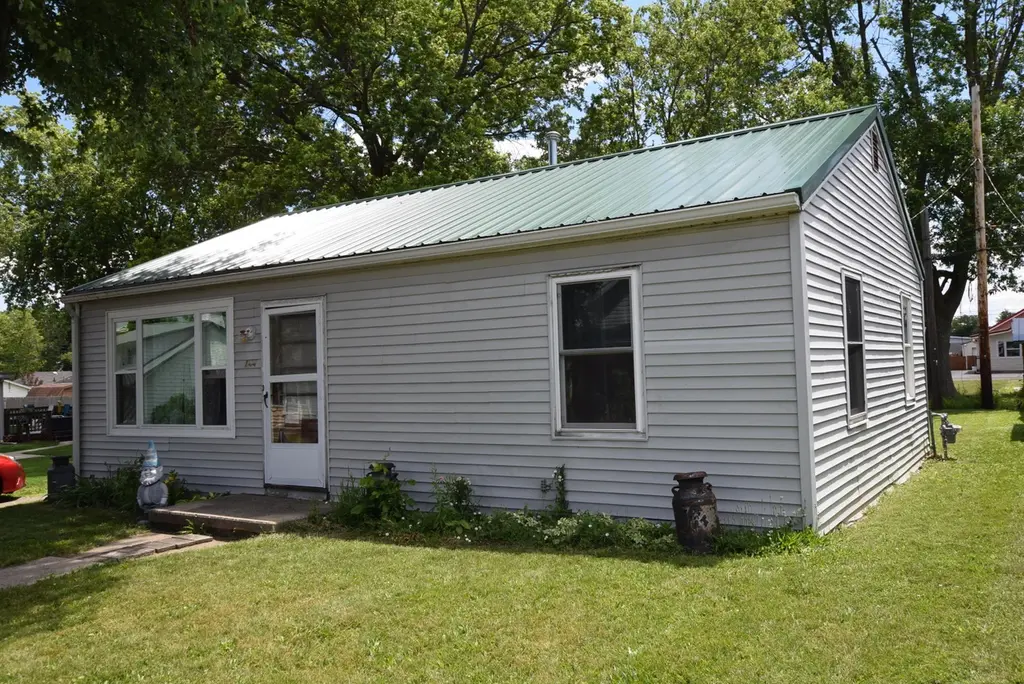
144 Warren Ave
Russells Point, OH 43348
$1B-
2 bd · 1.0 ba ·
768 sqft ·
Built 1952
· SingleFamily
· Active
· 5 DOM
Cashflow @ list (25.0% down · 7.5%)
Estimated rent
$1,605/mo
Mortgage (P&I)
−$673
Tax + insurance
−$214
HOA
−$0
Vac / Maint / Mgmt
−$337
Net cashflow
$382/mo
Annual
$4,579/yr
Cap rate
9.86%
Cash-on-cash
12.75%
DSCR
1.57
1% rule
1.25%
Cash to close
$35,912
Investor read
- This is a 2-bed/1.0-bath single-family listed at $1.
- At list price, monthly cash flow is $382 ($5k/yr) — positive.
- The deal already cash-flows at list — no discount required.
- Meets the 1% rule at list price ($2k rent vs $1).
- Only 5 days on market — expect competitive offers; lowballing is unlikely to land.
- Local home prices are declining (-3.0%/yr); year-one equity from $887 of loan paydown is wiped out by about $4k of value loss. Plan a longer hold.
- Location reads 60/100 on livability (#971 in OH) — a middle-class / working-renter tenant base. Strengths: crime A+, cost of living A+, housing A; Watch: amenities F, commute F, employment F.
- Indian Lake Local (rural): math 59% / reading 66% proficiency, ranked #261 of 656 in OH (top 40%) — acceptable for families but not a draw, mixed tenant base, ~2y average lease.
- Zoned schools: Indian Lake Elementary School (math 72% / reading 67%, grade A-, #391 of 1,584 statewide, top 27%, 510 students, 45% FRL); Indian Lake Middle School (math 56% / reading 65%, grade B+, #259 of 654 statewide, top 40%, 407 students, 42% FRL); Indian Lake High School (math 52% / reading 72%, grade B-, #202 of 781 statewide, top 29%, 492 students, 34% FRL) — zoned schools at 40% FRL track the district average.
- Watch-outs: property tax is 192384.0% of price; built in 1952 — expect roof / HVAC / electrical / plumbing capex.
- Market conditions: 49 active listings in the ZIP; 2 comparable units currently listed for rent nearby; 121 units permitted in Logan County in 2024 (0 in 5+ unit buildings).
- Logan County population projected at -15% by 2050 — secular population decline; favor cash flow + early exit over multi-decade hold.
- At projected returns (-3.0% appreciation + 3.0% rent growth), your $36k cash investment doubles in ~9 years — after that, you're playing with house money.
- Cap rate 9.9% vs local median 2.8% in Russells Point — top-decile yield for the area; either an underpriced asset or a hidden risk that comps aren't pricing in. Stress-test before assuming the spread holds.
- This rent runs 38% of the median local income ($51k/yr) — at the standard rent-burdened threshold; future hikes will face affordability resistance.
Questions for listing agent
- Built in 1952 — when were the roof, HVAC, electrical panel, plumbing, and water heater last replaced?
- Property tax is high relative to price — has the assessment been appealed recently, and will the sale trigger a re-assessment?
- Is there a deadline driving the sale (1031 exchange, divorce, estate, relocation)? That informs how much negotiation room exists.
- Schools are F-rated, which usually means shorter tenancies and higher turnover. Who's the typical renter profile here, and what's been the actual vacancy rate?
- What's the average days-on-market for RENTAL listings here right now (not sales)? A rising rental-DOM trend means longer vacancies and softer asking-rent achievability than the comps imply.
- What's the recent tenant-quality profile in this submarket — average credit score on applications, eviction rate, late-payment / NSF rate, and stable-employment percentage? A property-management company in the area should have these aggregated.
- How much new for-sale + rental construction is in the pipeline within 1–3 miles? Heavy new supply typically softens prices + rents 12–24 months out; constrained supply supports both.
CashFlowRE · CFR-NEHY0X9ZE2SRFY
· Data 17 h ago
cashflowre.app · 2026-05-29