 🔨 Auction
144 Warren Ave · Russells Point, OH
Flood risk 1/10 · Minimal
- FEMA flood zone
- X (unshaded)
- Chance of flooding over 30 yrs
- 0.0%
- Est. flood insurance / yr
- $507 – $1,088
Fire risk 1/10 · Minimal
- Est. fire insurance / yr
- $713 – $1,323
Heat risk 3/10 · Minor
- Hot days now (above 100°F)
- 7 days/yr
- Hot days in 30 yrs
- 18 days/yr
Wind risk 2/10 · Minimal
- Chance of severe wind over 30 yrs
- —
Air-quality risk 2/10 · Minimal
- Unhealthy air days now
- 1 days/yr
- Unhealthy air days in 30 yrs
- 2 days/yr
Risk factors via First Street. Map © Google.
Why this score? — see what drove the B- grade
The composite is a weighted blend of 9 inputs, each scored 0–100. Each bar is that input's sub-score; the figure is the points it added to the 100-point composite (weight × sub-score).
- Cash flow +27.6/30.0
- DSCR +9.7/10.0
- 1% rule +7.5/10.0
- ARV discount +7.5/15.0
- Schools +5.3/10.0
- Livability +3.0/5.0
- Rent growth +2.5/5.0
- Condition / age +2.5/5.0
- Appreciation +0.0/10.0
$1
🖨 Deal sheet (PDF) 📄 Offer letter ✓ Due diligence
Listing remarks
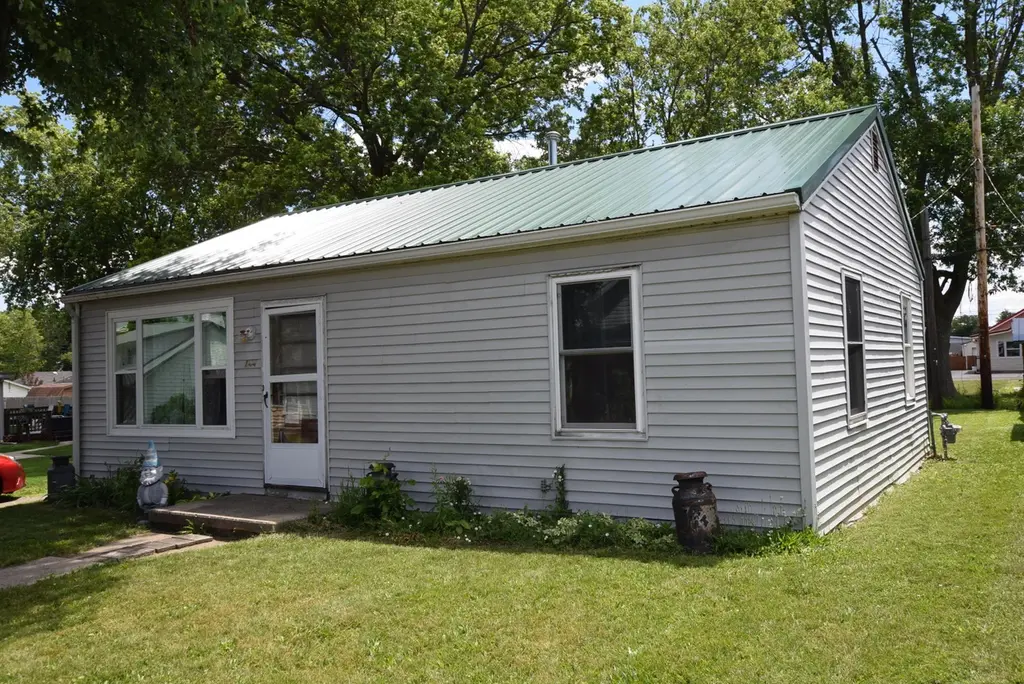
Here is a 2 bedroom cottage with a 1 car garage and a view of Indian Lake that will be up for auction on July 23rd at 6:30pm. Currently rented for $550/month with a lease through March 2027. A new metal roof in 2023, new plumbing in 2024, and sewer repair in 2025.
Key facts
- New metal roof
- New plumbing
- View of indian lake
Tags
Property features AI
Exterior
- Parking: Has garage; 1-car garage
- Utilities: Supplied water; Public sewer; Natural gas connected; Sewer connected
- Home design: Single-family residence; Residential property; Built in 1952
- Construction: Vinyl siding; Block foundation
- Exterior features: Lake-related waterfront; Residential lot; Lot dimensions approximately 58 x 95
Interior
- Kitchen: Kitchen (11 x 8); Electric water heater
- Bedrooms: Bedroom 1 (12 x 10); Bedroom 2 (13 x 10)
- Flooring: Wood floors
- Bathrooms: 1 full bathroom
- Heating & cooling: Forced air heating (natural gas); Window cooling units
- Interior features: Attic; Ceiling fan(s); 5 total rooms
- Laundry & utility: Utility room (11 x 8); Crawl space
Neighborhood map
What this means for you Summary
Snapshot
- This is a 2-bed/1.0-bath single-family listed at $1.
Deal economics
- At list price, monthly cash flow is $382 ($5k/yr) — positive.
- The deal already cash-flows at list — no discount required.
- Meets the 1% rule at list price ($2k rent vs $1).
- Cap rate 9.9% vs local median 2.8% in Russells Point — top-decile yield for the area; either an underpriced asset or a hidden risk that comps aren't pricing in. Stress-test before assuming the spread holds.
Location & tenants
- Location reads 60/100 on livability (#971 in OH) — a middle-class / working-renter tenant base. Strengths: crime A+, cost of living A+, housing A; Watch: amenities F, commute F, employment F.
- Indian Lake Local (rural): math 59% / reading 66% proficiency, ranked #261 of 656 in OH (top 40%) — acceptable for families but not a draw, mixed tenant base, ~2y average lease.
- Zoned schools: Indian Lake Elementary School (math 72% / reading 67%, grade A-, #391 of 1,584 statewide, top 27%, 510 students, 45% FRL); Indian Lake Middle School (math 56% / reading 65%, grade B+, #259 of 654 statewide, top 40%, 407 students, 42% FRL); Indian Lake High School (math 52% / reading 72%, grade B-, #202 of 781 statewide, top 29%, 492 students, 34% FRL) — zoned schools at 40% FRL track the district average.
- Market conditions: 49 active listings in the ZIP; 2 comparable units currently listed for rent nearby; 121 units permitted in Logan County in 2024 (0 in 5+ unit buildings).
- This rent runs 38% of the median local income ($51k/yr) — at the standard rent-burdened threshold; future hikes will face affordability resistance.
Forward outlook
- Local home prices are declining (-3.0%/yr); year-one equity from $887 of loan paydown is wiped out by about $4k of value loss. Plan a longer hold.
- Logan County population projected at -15% by 2050 — secular population decline; favor cash flow + early exit over multi-decade hold.
- At projected returns (-3.0% appreciation + 3.0% rent growth), your $36k cash investment doubles in ~9 years — after that, you're playing with house money.
Negotiation context
- Only 5 days on market — expect competitive offers; lowballing is unlikely to land.
Risks & watch-outs
- Watch-outs: property tax is 192384.0% of price; built in 1952 — expect roof / HVAC / electrical / plumbing capex.
Questions for the listing agent
- Built in 1952 — when were the roof, HVAC, electrical panel, plumbing, and water heater last replaced?
- Property tax is high relative to price — has the assessment been appealed recently, and will the sale trigger a re-assessment?
- Is there a deadline driving the sale (1031 exchange, divorce, estate, relocation)? That informs how much negotiation room exists.
- Schools are F-rated, which usually means shorter tenancies and higher turnover. Who's the typical renter profile here, and what's been the actual vacancy rate?
- What's the average days-on-market for RENTAL listings here right now (not sales)? A rising rental-DOM trend means longer vacancies and softer asking-rent achievability than the comps imply.
- What's the recent tenant-quality profile in this submarket — average credit score on applications, eviction rate, late-payment / NSF rate, and stable-employment percentage? A property-management company in the area should have these aggregated.
- How much new for-sale + rental construction is in the pipeline within 1–3 miles? Heavy new supply typically softens prices + rents 12–24 months out; constrained supply supports both.
Investment metrics
- 1% rule
- 1.25% ✓
- Cap rate
- 9.86%
- Cash-on-cash
- 12.75%
- DSCR
- 1.57
- GRM
- 6.7
CMA / ARV
- ARV (on-the-fly)
- $128,256
- Comps found
- 11
Show comp detail 11 sales within ~0.75 mi
| Address | Dist | Beds/Ba | Sqft | Sold | Price | $/sf | Match |
|---|---|---|---|---|---|---|---|
| 210 E Elliott Rd | 0.33mi | 2/1.0 | 704 (-8%) | 1mo | $80,000 | $114 | 70 |
| 9713 Mauger St | 0.60mi | 2/1.0 | 756 (-2%) | 3mo | $285,000 | $377 | 67 |
| 351 Taylor Ave | 0.17mi | 2/1.0 | 689 (-10%) | 21mo | $35,000 | $51 | 58 |
| 8907 Court St | 0.54mi | 2/1.0 | 756 (-2%) | 18mo | $126,500 | $167 | 57 |
| 357 3rd St | 0.52mi | 2/1.0 | 665 (-13%) | 1mo | $145,000 | $218 | 53 |
| 205 2nd St | 0.37mi | 3/1.0 (+1) | 844 (+10%) | 11mo | $103,000 | $122 | 52 |
| 9004 Walnut St | 0.68mi | 3/1.0 (+1) | 720 (-6%) | 7mo | $86,000 | $119 | 47 |
| 9796 Cottage Ave | 0.70mi | 2/1.5 | 810 (+6%) | 16mo | $363,750 | $449 | 42 |
| 9010 Crescent St | 0.54mi | 2/1.0 | 698 (-9%) | 22mo | $179,500 | $257 | 41 |
| 8907 Auditorium St | 0.62mi | 2/1.0 | 704 (-8%) | 20mo | $215,000 | $305 | 41 |
| 8960 Maple St | 0.67mi | 2/1.0 | 846 (+10%) | 13mo | $59,400 | $70 | 40 |
Match score weights: distance 35% · size 25% · config 20% · recency 20%. Top-matched comps best support the ARV.
Projected returns pro-forma
-3.0% appreciation · 3.0% rent growth · sell at horizon
- IRR
- 2.6%
- Equity multiple
- 1.10×
- Total profit
- $3,546
- Equity at exit
- $19,123
- IRR
- 12.2%
- Equity multiple
- 1.96×
- Total profit
- $34,482
- Equity at exit
- $11,089
Cash invested: $35,912 (down + closing). Projections, not guarantees.
Landlord ↔ Tenant lean methodology
- Overall (STATE)
- 73 Landlord-Friendly
- State Ohio
- 73 Landlord-Friendly · R+6
- County
- — inherits STATE
- City
- — inherits STATE
ZIP-level market 43348
- Home prices YoY
- -29.2%
- Active inventory
- 49
Monthly cashflow live
- Estimated rent
- $1,605 medium interval (Pro) →
- Mortgage (P&I)
- −$673
- Tax est. 1.5%
- −$160 /mo · $1,924/yr
- Insurance
- −$53
- HOA
- −$0
- Vacancy / Maint / Mgmt
- −$337
- Net cashflow
- $382
Break-even live
Sensitivity live
| Price | -10% $470 | -5% $426 | +0% $382 | +5% $337 | +10% $293 |
|---|---|---|---|---|---|
| Rent | -10% $255 | -5% $318 | +0% $382 | +5% $445 | +10% $508 |
| Rate | -1.0pp $446 | -0.5pp $414 | base $382 | +0.5pp $348 | +1.0pp $315 |
UW: 25.0% down · 7.5% · 30yr · 1.5% tax · 5.0% vac · 8.0% maint · 8.0% mgmt
Financing live
Cash to close
- Down payment
- $32,064
- Closing costs
- $3,848
- Reserves months
- —
- Total cash needed
- —
Loan-product check · same deal, 3 products live
Conventional
25% down · 7.5% · 30yr
- Down + closing
- —
- Monthly P&I
- —
- Monthly cashflow
- —
- DSCR
- —
- Eligible?
- —
Personal DTI + credit; lowest rate.
DSCR
20% down · 8.5% · 30yr
- Down + closing
- —
- Monthly P&I
- —
- Monthly cashflow
- —
- DSCR
- —
- Eligible?
- —
No personal income docs; deal must DSCR.
Hard money
10% down · 12.0% · 12mo
- Down + closing
- —
- Monthly P&I
- —
- Monthly cashflow
- —
- DSCR
- —
- Eligible?
- —
Short-term bridge; refi at stabilization.
Rent comps 2 comps
| Address | Beds | Baths | Sqft | Rent | $/sqft | DOM | Units | Dist |
|---|---|---|---|---|---|---|---|---|
| 8926 Franklin Ave Lakeview, OH | 2.0 | 1.0 | 696 | $1,605 | $2.31 | 3d | 1 | 1.15mi |
| 8926 Franklin Ave Unit B Lakeview, OH | 2.0 | 1.0 | 696 | $1,605 | $2.31 | 3d | 1 | 1.15mi |
Listing history 5 events
-
2026-06-21days on market $1 Active 5 DOM
-
2026-06-21days on market $1 Active 4 DOM
-
2026-06-18days on market $1 Active 2 DOM
-
2026-06-17remarks 265-char remark
-
2026-06-17$1 Active 1 DOM
ⓘ Source: listings_history table (triggers on properties + properties_extension) + one-shot
backfill from property_details.listing_events for pre-trigger history.
Climate risk First Street
- Flood 1/10 Low FEMA zone X (unshaded) · 0% chance over 30 yrs
- Wildfire 1/10 Low
- Heat 3/10 Moderate 7 d/yr ≥100°F today · 18 d/yr by 30 yrs out
- Wind 2/10 Low
- Air quality 2/10 Low 1 unhealthy d/yr today · 2 by 30 yrs out
Nearby sold comps map
Loading sold comps map…
Walkable amenities ~0.75 mi
Loading nearby amenities…
Taxation est. · year 1
- Rental income
- $19,260
- − Mortgage interest
- −$7,184
- − Property taxes
- −$1,924
- − Insurance
- −$641
- − Repairs & maintenance
- −$1,541
- − Management
- −$1,541
- − Depreciation
- −$3,731
- Taxable income
- $2,698
- Est. tax owed @ 24.0%
- −$647
- After-tax cash flow
- $3,932/yr
For passive investors: Depreciation is non-cash, so a rental often shows a tax loss while cash-flowing — sheltering income. Rental losses are passive: they offset passive income freely, and up to $25,000/yr can offset ordinary (W-2) income if you actively participate and your MAGI is under $100k (phasing out to $0 by $150k); unused losses carry forward. On sale, claimed depreciation is recaptured at up to 25%, and gains may owe capital-gains tax (a 1031 exchange can defer both). Figures are a year-1 estimate at your 24.0% rate — not tax advice; consult a CPA.
Schools (NCES district)
- District
- Indian Lake Local
- NCES district ID
- 3904808
- Math proficiency
- 59% ▼ -14.00%
- Reading proficiency
- 66% ▼ -4.00%
- Median HH income
- $44,496
- Composite
- 52.6/100
- National rank
- #1559
- State rank
- #261 of 656 in OH
Livability — Russells Point
- Score
- 60/100
- State rank
- #971
- US rank
- #18804
Category grades
Schools grade is shown separately in the Schools card above.
Census & demographics
- Census place
- Russells Point, OH
- County
- Logan · 47,256 people
- City population
- 1,865
- Population (ZIP)
- 1,865
- Household income
- $50,658
- Rent vs Own
- Severe rent burden
- 7.3
Population outlook (Logan County) Hauer SSP2
- Today (2025)
- 44,240 people
- By 2030
- 43,166 · -2.4%
- By 2040
- 40,495 · -8.5%
- By 2050
- 37,511 · -15.2%
- By 2075
- 30,453 · -31.2%
- By 2100
- 23,081 · -47.8%
Race, ethnicity, and origin ACS 2023
- Neighborhood character
- Predominantly White (92%)
- Race & ethnicity
- White 92% Black 3% Two or more races 2% Hispanic / Latino 2%
- Common ancestry
- Lithuanian 3% Czech 2% Italian 1%
- Foreign-born
- 1% · Canada
Political lean MEDSL · Logan
- 2024 margin
- Solid R (+56.2) · D 21.5% · R 77.7%
- 2008→2024 swing
- -29.6pp toward R · 2008: -26.6pp · 2024: -56.2pp
- All cycles
- 2024: R+56.2 2020: R+55.2 2016: R+52.6 2012: R+31.8 2008: R+26.6
Not yet ingested
- Civics
- —
Market trends
- HPI YoY
- ▼ -108.07%
- Current HPI
- 261.3567
- Rent YoY
- —
- Metro
- —
- State GDP YoY
- ▲ 1.98%
- F500 in state
- 48
Industry mix (Fortune 500 HQ in OH)
| Industry | F500 HQs | Revenue |
|---|---|---|
| Insurance | 3 | $145B |
|
||
| Industrial Machinery | 3 | $49B |
|
||
| Financial Services | 3 | $24B |
|
||
| Consumer Goods | 2 | $93B |
|
||
| Aerospace / Defense | 2 | $47B |
|
||
| Utilities | 2 | $33B |
|
||
Property tax history
+3.5%/yrLatest (2025): $920 · +20.1% YoY. Source: county tax records.
Cash-flow waterfall
monthlySold comps — $/sqft
last 12 mo · ≤1 miLoading sold comps…