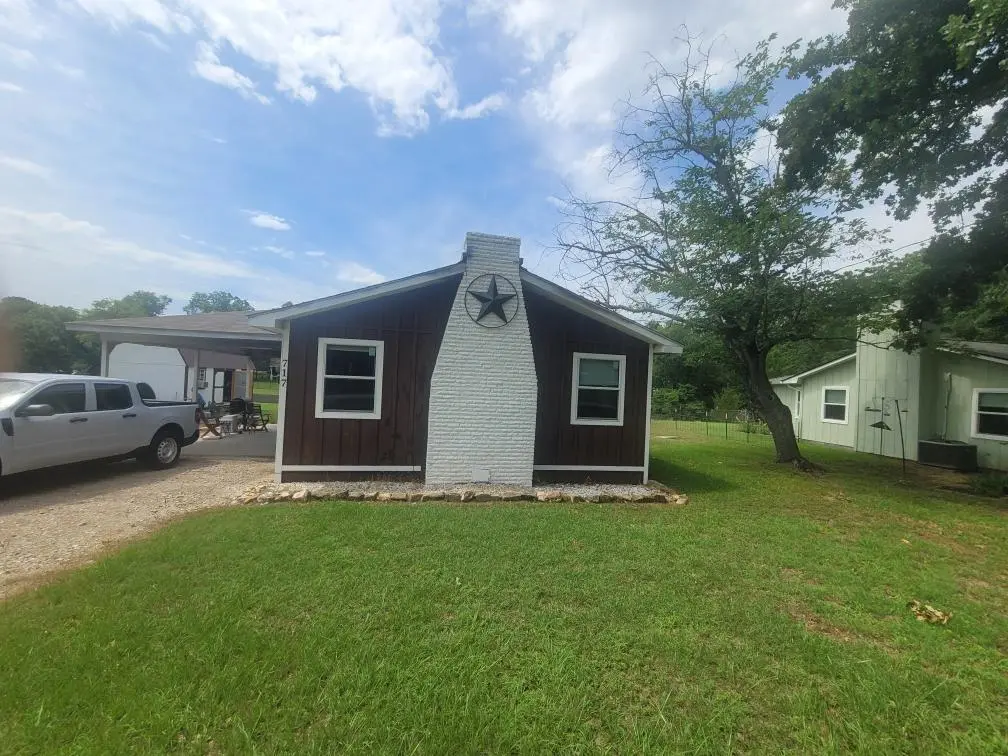
717 Midway Rd
Tool, TX 75143
$65,000B
2 bd · 2.0 ba ·
1,386 sqft ·
Built 1967
· SingleFamily
· Active
· 18 DOM
Cashflow @ list (25.0% down · 7.5%)
Estimated rent
$1,803/mo
Mortgage (P&I)
−$341
Tax + insurance
−$108
HOA
−$60
Vac / Maint / Mgmt
−$379
Net cashflow
$916/mo
Annual
$10,986/yr
Cap rate
23.20%
Cash-on-cash
60.36%
DSCR
3.69
1% rule
2.77%
Cash to close
$18,200
Investor read
- This is a 2-bed/2.0-bath single-family listed at $65k.
- At list price, monthly cash flow is $916 ($11k/yr) — positive.
- The deal already cash-flows at list — no discount required.
- Meets the 1% rule at list price ($2k rent vs $65k).
- It's been on market 18 days — a 2% lower offer ($64k) is reasonable based on typical stale-listing flexibility.
- Recommended offer: $64k (1.5% below list) — sets the bar for market timing.
- Local home prices are declining (-3.0%/yr); year-one equity from $449 of loan paydown is wiped out by about $2k of value loss. Plan a longer hold.
- Location reads 66/100 on livability (#651 in TX) — a middle-class / working-renter tenant base. Strengths: crime A+, cost of living A+, housing A+; Watch: employment D, amenities F, commute F.
- Malakoff ISD (town): math 48% / reading 54% proficiency, ranked #187 of 826 in TX (top 23%) — acceptable for families but not a draw, mixed tenant base, ~2y average lease; 61% free/reduced lunch — lower-income household profile, screen leases tightly.
- Zoned schools: Malakoff El (math 58% / reading 54%, grade C+, #574 of 4,322 statewide, top 14%, 457 students, 75% FRL).
- Market conditions: 440 active listings in the ZIP; 2 comparable units currently listed for rent nearby; 263 units permitted in Henderson County in 2024 (0 in 5+ unit buildings).
- 5 sale attempts since 11y ago; this cycle's ask has dropped $5k (7%) from the opening price — seller is motivated, your offer sets the floor, not the list.
- At projected returns (-3.0% appreciation + 3.0% rent growth), your $18k cash investment doubles in ~2 years — after that, you're playing with house money.
- Climate carrying-cost: major wind risk, 61% chance of damaging wind over 30y; extreme-heat days projected 7→26/yr by 2055 (HVAC capex compounding) — expect insurance premiums to compound above CPI over the hold.
- Cap rate 23.2% vs local median 2.8% in Tool — top-decile yield for the area; either an underpriced asset or a hidden risk that comps aren't pricing in. Stress-test before assuming the spread holds.
Questions for listing agent
- Built in 1967 — when were the roof, HVAC, electrical panel, plumbing, and water heater last replaced?
- What does the HOA fee cover, when was the last increase, and are there any pending special assessments or reserve-fund shortfalls?
- Is there a deadline driving the sale (1031 exchange, divorce, estate, relocation)? That informs how much negotiation room exists.
- What's the average days-on-market for RENTAL listings here right now (not sales)? A rising rental-DOM trend means longer vacancies and softer asking-rent achievability than the comps imply.
- What's the recent tenant-quality profile in this submarket — average credit score on applications, eviction rate, late-payment / NSF rate, and stable-employment percentage? A property-management company in the area should have these aggregated.
- How much new for-sale + rental construction is in the pipeline within 1–3 miles? Heavy new supply typically softens prices + rents 12–24 months out; constrained supply supports both.
CashFlowRE · CFR-NETRZ9E96TVVN3
· Data 1 day ago
cashflowre.app · 2026-05-29