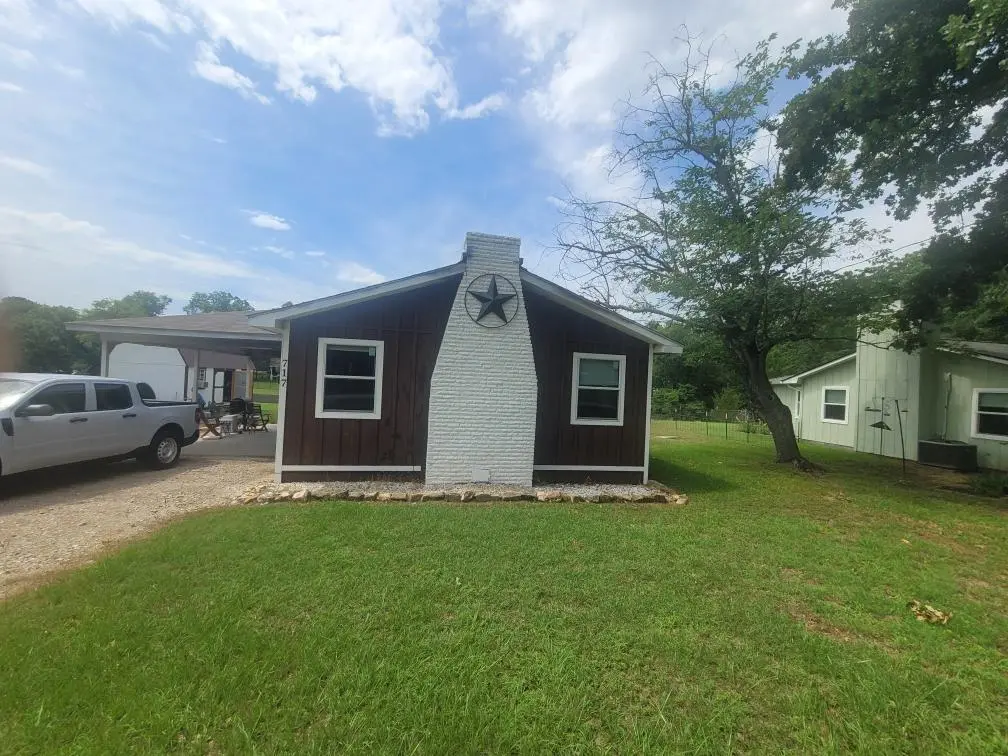
717 Midway Rd · Tool, TX
Flood risk 1/10 · Minimal
- FEMA flood zone
- X (unshaded)
- Chance of flooding over 30 yrs
- 0.0%
- Est. flood insurance / yr
- $507 – $1,088
Fire risk 4/10 · Minor
- Est. fire insurance / yr
- $1,222 – $2,270
Heat risk 7/10 · Major
- Hot days now (above 110°F)
- 7 days/yr
- Hot days in 30 yrs
- 26 days/yr
Wind risk 6/10 · Moderate
- Chance of severe wind over 30 yrs
- 61.0%
Air-quality risk 2/10 · Minimal
- Unhealthy air days now
- 0 days/yr
- Unhealthy air days in 30 yrs
- 1 days/yr
Risk factors via First Street. Map © Google.
Why this score? — see what drove the B grade
The composite is a weighted blend of 9 inputs, each scored 0–100. Each bar is that input's sub-score; the figure is the points it added to the 100-point composite (weight × sub-score).
- Cash flow +30.0/30.0
- 1% rule +10.0/10.0
- DSCR +10.0/10.0
- ARV discount +7.5/15.0
- Schools +4.3/10.0
- Livability +3.3/5.0
- Rent growth +2.5/5.0
- Condition / age +2.5/5.0
- Appreciation +0.0/10.0
$65,000
🖨 Deal sheet 📄 Offer letter ✓ Due diligence
Listing remarks MLS
Adorable get away cabin at Cedar Creek Lake. This 2 BR 2 BTH has large bedrooms, beautiful WBFP in living room and cute, functional galley kitchen. POA offers lake access with 2 boat launches and parks. New roof in summer 2021. Wonderful place to go for some cozy time away from the city. Can be used as a vacation rental or just your own comfy retreat. Being sold fully furnished and ready to enjoy! Fire pit and water toys included. POA park is located within walking distance.With a full lake, water in channel allows access for fishing, kayaking and boating.
Key facts
- Lake area setting
- Water access
- 7,971 sq ft lot
Tags
Property features AI
Finance
- Other: Municipal Utility District: Yes
- Financial info: Loan type: Treat As Clear; No second mortgage indicated
- HOA & community: Mandatory association (Paradise Bay POA); Monthly association fee of $60; Association fee includes full use of facilities
Exterior
- Parking: Carport (1 covered carport space)
- Utilities: MUD water; MUD sewer; Other utilities
- Home design: Single-family residence; Residential property; Built in 1967; Property is not attached
- Construction: Year built: 1967
- Exterior features: Lot less than 0.5 acre (approx. 0.183 acres); Subdivision: Paradise Bay; Directions: From Seven Points, take TX 274 south. Turn left into Paradise Bay, left on Kalura Way, right on Owhyhe Road, then right on Midway Road. Property will be on the right.
Interior
- Kitchen: Appliances: Other
- Bedrooms: 2 bedrooms (both on the main level)
- Bathrooms: 2 full bathrooms
- Interior features: One-level layout; One living area; One dining area; Total of 4 rooms; Fireplace (1) — Other
- Laundry & utility: Utilities include MUD water and MUD sewer
Neighborhood map
What this means for you Summary
Snapshot
- This is a 2-bed/2.0-bath single-family listed at $65k.
Deal economics
- At list price, monthly cash flow is $916 ($11k/yr) — positive.
- The deal already cash-flows at list — no discount required.
- Meets the 1% rule at list price ($2k rent vs $65k).
- Recommended offer: $64k (1.5% below list) — sets the bar for market timing.
- Cap rate 23.2% vs local median 2.8% in Tool — top-decile yield for the area; either an underpriced asset or a hidden risk that comps aren't pricing in. Stress-test before assuming the spread holds.
Location & tenants
- Location reads 66/100 on livability (#651 in TX) — a middle-class / working-renter tenant base. Strengths: crime A+, cost of living A+, housing A+; Watch: employment D, amenities F, commute F.
- Malakoff ISD (town): math 48% / reading 54% proficiency, ranked #187 of 826 in TX (top 23%) — acceptable for families but not a draw, mixed tenant base, ~2y average lease; 61% free/reduced lunch — lower-income household profile, screen leases tightly.
- Zoned schools: Malakoff El (math 58% / reading 54%, grade C+, #574 of 4,322 statewide, top 14%, 457 students, 75% FRL).
- Market conditions: 440 active listings in the ZIP; 2 comparable units currently listed for rent nearby; 263 units permitted in Henderson County in 2024 (0 in 5+ unit buildings).
Forward outlook
- Local home prices are declining (-3.0%/yr); year-one equity from $449 of loan paydown is wiped out by about $2k of value loss. Plan a longer hold.
- At projected returns (-3.0% appreciation + 3.0% rent growth), your $18k cash investment doubles in ~2 years — after that, you're playing with house money.
Negotiation context
- It's been on market 18 days — a 2% lower offer ($64k) is reasonable based on typical stale-listing flexibility.
- 5 sale attempts since 11y ago; this cycle's ask has dropped $5k (7%) from the opening price — seller is motivated, your offer sets the floor, not the list.
Risks & watch-outs
- Climate carrying-cost: major wind risk, 61% chance of damaging wind over 30y; extreme-heat days projected 7→26/yr by 2055 (HVAC capex compounding) — expect insurance premiums to compound above CPI over the hold.
Questions for the listing agent
- Built in 1967 — when were the roof, HVAC, electrical panel, plumbing, and water heater last replaced?
- What does the HOA fee cover, when was the last increase, and are there any pending special assessments or reserve-fund shortfalls?
- Is there a deadline driving the sale (1031 exchange, divorce, estate, relocation)? That informs how much negotiation room exists.
- What's the average days-on-market for RENTAL listings here right now (not sales)? A rising rental-DOM trend means longer vacancies and softer asking-rent achievability than the comps imply.
- What's the recent tenant-quality profile in this submarket — average credit score on applications, eviction rate, late-payment / NSF rate, and stable-employment percentage? A property-management company in the area should have these aggregated.
- How much new for-sale + rental construction is in the pipeline within 1–3 miles? Heavy new supply typically softens prices + rents 12–24 months out; constrained supply supports both.
Investment metrics
- 1% rule
- 2.77% ✓
- Cap rate
- 23.20%
- Cash-on-cash
- 60.36%
- DSCR
- 3.69
- GRM
- 3.0
CMA / ARV
- ARV (on-the-fly)
- $439,362
- Comps found
- 12
Show comp detail 12 sales within ~0.75 mi
| Address | Dist | Beds/Ba | Sqft | Sold | Price | $/sf | Match |
|---|---|---|---|---|---|---|---|
| 1011 Maloma Ct | 0.08mi | 3/2.0 (+1) | 1,492 (+8%) | 2mo | $247,000 | $166 | 77 |
| 219 Midway Rd | 0.21mi | 3/2.0 (+1) | 1,380 (-0%) | 10mo | $259,900 | $188 | 76 |
| 1500 Villa Cove Dr | 0.28mi | 3/2.0 (+1) | 1,470 (+6%) | 10mo | $725,000 | $493 | 63 |
| 524 Sampan Dr | 0.51mi | 2/2.0 | 1,510 (+9%) | 7mo | $789,000 | $523 | 55 |
| 1313 Aloha Rd | 0.49mi | 2/2.0 | 1,280 (-8%) | 11mo | $275,000 | $215 | 55 |
| 207 Tanglewood Dr | 0.59mi | 3/2.0 (+1) | 1,404 (+1%) | 16mo | $314,500 | $224 | 52 |
| 1805 Scenic Dr | 0.53mi | 3/2.0 (+1) | 1,298 (-6%) | 12mo | $425,000 | $327 | 50 |
| 201 Isle Of View Dr | 0.63mi | 3/2.0 (+1) | 1,498 (+8%) | 4mo | $475,000 | $317 | 49 |
| 1008 Hwy 274 | 0.53mi | 3/2.0 (+1) | 1,472 (+6%) | 14mo | $225,000 | $153 | 48 |
| 708 Kontiki Dr | 0.31mi | 3/2.0 (+1) | 1,232 (-11%) | 20mo | $269,000 | $218 | 46 |
| 1525 Oak Shore Dr | 0.33mi | 2/2.0 | 1,204 (-13%) | 22mo | $599,000 | $498 | 45 |
| 114 Ridgeoak Way | 0.62mi | 3/2.0 (+1) | 1,440 (+4%) | 19mo | $735,000 | $510 | 44 |
Match score weights: distance 35% · size 25% · config 20% · recency 20%. Top-matched comps best support the ARV.
Projected returns pro-forma
-3.0% appreciation · 3.0% rent growth · sell at horizon
- IRR
- 59.2%
- Equity multiple
- 3.63×
- Total profit
- $47,842
- Equity at exit
- $9,692
- IRR
- 63.9%
- Equity multiple
- 7.43×
- Total profit
- $117,005
- Equity at exit
- $5,620
Cash invested: $18,200 (down + closing). Projections, not guarantees.
Landlord ↔ Tenant lean methodology
- Overall (STATE)
- 87 Strongly Landlord-Friendly
- State Texas
- 87 Strongly Landlord-Friendly · R+5
- County
- — inherits STATE
- City
- — inherits STATE
ZIP-level market 75143
- Home prices YoY
- -11.4%
- Active inventory
- 440
- Price-to-rent
- 3.0×
Monthly cashflow live
- Estimated rent
- $1,803 medium interval (Pro) →
- Mortgage (P&I)
- −$341
- Tax est. 1.5%
- −$81 /mo · $975/yr
- Insurance
- −$27
- HOA
- −$60
- Vacancy / Maint / Mgmt
- −$379
- Net cashflow
- $916
Break-even live
UW: 25.0% down · 7.5% · 30yr · 1.5% tax · 5.0% vac · 8.0% maint · 8.0% mgmt
Financing live
Cash to close
- Down payment
- $16,250
- Closing costs
- $1,950
- Reserves months
- —
- Total cash needed
- —
Loan-product check · same deal, 3 products live
Conventional
25% down · 7.5% · 30yr
- Down + closing
- —
- Monthly P&I
- —
- Monthly cashflow
- —
- DSCR
- —
- Eligible?
- —
Personal DTI + credit; lowest rate.
DSCR
20% down · 8.5% · 30yr
- Down + closing
- —
- Monthly P&I
- —
- Monthly cashflow
- —
- DSCR
- —
- Eligible?
- —
No personal income docs; deal must DSCR.
Hard money
10% down · 12.0% · 12mo
- Down + closing
- —
- Monthly P&I
- —
- Monthly cashflow
- —
- DSCR
- —
- Eligible?
- —
Short-term bridge; refi at stabilization.
Rent comps 2 comps
| Address | Beds | Baths | Sqft | Rent | $/sqft | DOM | Units | Dist |
|---|---|---|---|---|---|---|---|---|
| 1813 Oak Shore Dr Tool, TX | 2.0 | 1.0 | 905 | $1,975 | $2.18 | 43d | 1 | 0.49mi |
| 1012 Whispering Springs Dr Tool, TX | 2.0 | 2.0 | 904 | $1,290 | $1.43 | 43d | 1 | 1.45mi |
HOA detail
- Monthly dues
- $60 · $720/yr
- Likely covers
- water
Listing history 12 events
-
2026-06-19days on market $65,000 Active 18 DOM
-
2026-06-18days on market $65,000 Active 17 DOM
-
2026-06-17days on market $65,000 Active 16 DOM
-
2026-06-16days on market $65,000 Active 15 DOM
-
2026-06-15days on market $65,000 Active 14 DOM
-
2026-06-14days on market $65,000 Active 12 DOM
-
2026-06-12pricedays on market $65,000 Active 11 DOM
-
2026-06-09days on market $70,000 Active 8 DOM
-
2026-06-08days on market $70,000 Active 7 DOM
-
2026-06-07days on market $70,000 Active 6 DOM
-
2026-06-01remarks 626-char remark
-
2026-06-01$70,000 Active 1 DOM
ⓘ Source: listings_history table (triggers on properties + properties_extension) + one-shot
backfill from property_details.listing_events for pre-trigger history.
Climate risk First Street
- Flood 1/10 Low FEMA zone X (unshaded) · 0% chance over 30 yrs
- Wildfire 4/10 Moderate
- Heat 7/10 Severe 7 d/yr ≥110°F today · 26 d/yr by 30 yrs out
- Wind 6/10 Major 61% chance of damaging wind over 30 yrs
- Air quality 2/10 Low 0 unhealthy d/yr today · 1 by 30 yrs out
Nearby sold comps map
Loading sold comps map…
Walkable amenities ~0.75 mi
Loading nearby amenities…
Taxation est. · year 1
- Rental income
- $21,642
- − Mortgage interest
- −$3,641
- − Property taxes
- −$975
- − Insurance
- −$325
- − Repairs & maintenance
- −$1,731
- − Management
- −$1,731
- − HOA
- −$720
- − Depreciation
- −$1,891
- Taxable income
- $10,627
- Est. tax owed @ 24.0%
- −$2,550
- After-tax cash flow
- $8,436/yr
For passive investors: Depreciation is non-cash, so a rental often shows a tax loss while cash-flowing — sheltering income. Rental losses are passive: they offset passive income freely, and up to $25,000/yr can offset ordinary (W-2) income if you actively participate and your MAGI is under $100k (phasing out to $0 by $150k); unused losses carry forward. On sale, claimed depreciation is recaptured at up to 25%, and gains may owe capital-gains tax (a 1031 exchange can defer both). Figures are a year-1 estimate at your 24.0% rate — not tax advice; consult a CPA.
Schools (NCES district)
- District
- Malakoff ISD
- NCES district ID
- 4828780
- Math proficiency
- 48% ▼ -14.00%
- Reading proficiency
- 54% ▼ -5.00%
- Median HH income
- $38,970
- Composite
- 42.54/100
- National rank
- #3200
- State rank
- #187 of 826 in TX
Livability — Tool
- Score
- 66/100
- State rank
- #651
- US rank
- #12292
Category grades
Schools grade is shown separately in the Schools card above.
Census & demographics
- Census place
- Tool, TX
- Population (ZIP)
- 14,676
Population outlook (Henderson County) Hauer SSP2
- Today (2025)
- 80,471 people
- By 2030
- 80,608 · +0.2%
- By 2040
- 80,087 · -0.5%
- By 2050
- 78,208 · -2.8%
- By 2075
- 72,423 · -10.0%
- By 2100
- 61,012 · -24.2%
Race, ethnicity, and origin ACS 2023
- Neighborhood character
- Predominantly White (80%)
- Race & ethnicity
- White 80% Hispanic / Latino 13% Two or more races 8% Black 2%
- Hispanic origin (detail)
- Mexican 13%
- Common ancestry
- Italian 2% Iranian 2% Lithuanian 1%
- Foreign-born
- 4% · Canada, China
- Languages at home
- 90% English-only · Spanish 9%
Political lean MEDSL · Henderson
- 2024 margin
- Solid R (+63.5) · D 18.0% · R 81.4%
- 2008→2024 swing
- -18.8pp toward R · 2008: -44.6pp · 2024: -63.5pp
- All cycles
- 2024: R+63.5 2020: R+60.2 2016: R+60.0 2012: R+54.8 2008: R+44.6
Not yet ingested
- Civics
- —
Market trends
- HPI YoY
- ▼ -42.99%
- Current HPI
- 332.57
- Rent YoY
- —
- Metro
- —
- State GDP YoY
- ▲ 3.95%
- F500 in state
- 110
Industry mix (Fortune 500 HQ in TX)
| Industry | F500 HQs | Revenue |
|---|---|---|
| Energy | 16 | $1,198B |
|
||
| Technology | 5 | $198B |
|
||
| Engineering / Construction | 4 | $72B |
|
||
| Energy Services | 3 | $60B |
|
||
| Utilities | 3 | $41B |
|
||
| Healthcare | 2 | $330B |
|
||
Price history
-17.6% since first listed21 events — show timeline
- 2026-05-29 Listed $70,000 NTREIS
- 2022-02-23 Sold (Public Records) — Public Records
- 2022-02-18 Sold (MLS) — HCBOR
- 2022-02-18 Sold (MLS) — NTREIS
- 2022-01-12 Pending — NTREIS
- 2022-01-05 Contingent — NTREIS
- 2021-12-02 Price Changed $199,500 NTREIS
- 2021-10-29 Price Changed $225,000 NTREIS
- 2021-09-25 Price Changed $249,500 NTREIS
- 2021-09-02 Price Changed $259,900 NTREIS
- 2021-07-23 Listed $199,500 HCBOR
- 2021-07-22 Listed $275,000 NTREIS
- 2021-02-10 Sold (Public Records) — Public Records
- 2016-06-07 Sold (Public Records) — Public Records
- 2016-06-03 Sold (MLS) — HCBOR
- 2016-06-03 Sold (MLS) — NTREIS
- 2016-04-21 Pending — NTREIS
- 2016-01-14 Price Changed $85,000 NTREIS
- 2015-10-30 Listed $95,000 NTREIS
- 2015-10-30 Listed $85,000 HCBOR
- 1999-11-10 Sold (Public Records) — Public Records
Property tax history
+6.0%/yrLatest (2025): $4,061 · +3.0% YoY. Source: county tax records.
Cash-flow waterfall
monthlySold comps — $/sqft
last 12 mo · ≤1 miLoading sold comps…