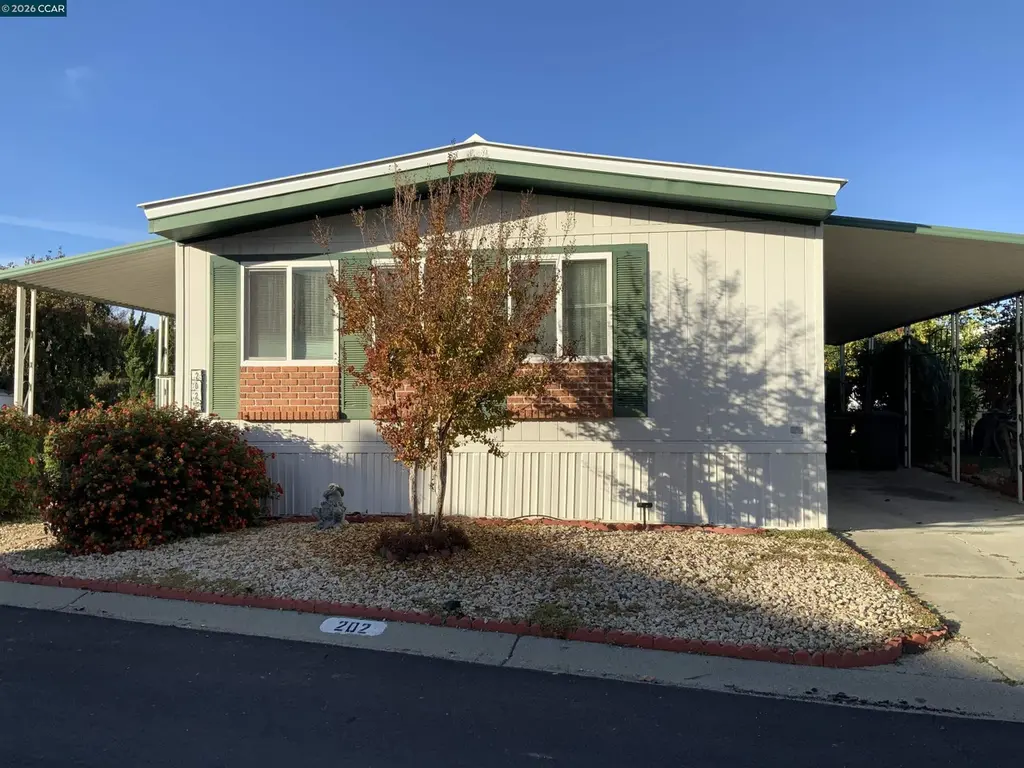
202 Queens Way
Pittsburg, CA 94565
$73,333B+
2 bd · 2.0 ba ·
1,248 sqft ·
Built 1978
· Manufactured
· Pending
· 8 DOM
Cashflow @ list (25.0% down · 7.5%)
Estimated rent
$2,633/mo
Mortgage (P&I)
−$385
Tax + insurance
−$122
HOA
−$0
Vac / Maint / Mgmt
−$553
Net cashflow
$1,573/mo
Annual
$18,881/yr
Cap rate
32.04%
Cash-on-cash
91.95%
DSCR
5.09
1% rule
3.59%
Cash to close
$20,533
Investor read
- This is a 2-bed/2.0-bath manufactured listed at $73k. Condition is rated fair.
- At list price, monthly cash flow is $2k ($19k/yr) — positive.
- The deal already cash-flows at list — no discount required.
- Meets the 1% rule at list price ($3k rent vs $73k).
- Only 8 days on market — expect competitive offers; lowballing is unlikely to land.
- Local home prices are declining (-3.0%/yr); year-one equity from $507 of loan paydown is wiped out by about $2k of value loss. Plan a longer hold.
- Location reads 58/100 on livability (#687 in CA) — a working-class tenant base; expect higher turnover. Strengths: employment A+, housing A+; Watch: schools F, crime D-, amenities F.
- Pittsburg Unified (suburban): math 21% / reading 35% proficiency, ranked #1,069 of 1,400 in CA (top 76%) — low school quality limits family demand, transient renter base, plan for 1-2y turnover; 66% free/reduced lunch — lower-income household profile, screen leases tightly.
- Market conditions: Rents rising (+1.1%/yr); 265 active listings in the ZIP; 22 comparable units currently listed for rent nearby; rentals at typical pace (median 19d on market — plan ~3-4 weeks tenant-placement turnaround); solid renter incomes; 2,169 units permitted in Contra Costa County in 2024 (896 in 5+ unit buildings).
- Contra Costa County population projected at +26% by 2050 — long-run rental-demand tailwind backs the buy-and-hold thesis.
- At projected returns (-3.0% appreciation + 1.1% rent growth), your $21k cash investment doubles in ~2 years — after that, you're playing with house money.
- Climate carrying-cost: major wildfire risk; extreme-heat days projected 7→14/yr by 2055 (HVAC capex compounding) — expect insurance premiums to compound above CPI over the hold.
- Cap rate 32.0% vs local median 3.4% in Pittsburg — top-decile yield for the area; either an underpriced asset or a hidden risk that comps aren't pricing in. Stress-test before assuming the spread holds.
- This rent runs 33% of the median local income ($96k/yr) — at the standard rent-burdened threshold; future hikes will face affordability resistance.
Questions for listing agent
- Have any recent inspections been done? Can we get a copy of the seller's disclosures and any deferred-maintenance estimates?
- Built in 1978 — when were the roof, HVAC, electrical panel, plumbing, and water heater last replaced?
- Is there a deadline driving the sale (1031 exchange, divorce, estate, relocation)? That informs how much negotiation room exists.
- Schools are F-rated, which usually means shorter tenancies and higher turnover. Who's the typical renter profile here, and what's been the actual vacancy rate?
- Crime grade is D in this area — have there been break-ins, vandalism, or insurance claims at this property in the last 3 years? What carrier currently insures it and at what premium?
- What's the average days-on-market for RENTAL listings here right now (not sales)? A rising rental-DOM trend means longer vacancies and softer asking-rent achievability than the comps imply.
- What's the recent tenant-quality profile in this submarket — average credit score on applications, eviction rate, late-payment / NSF rate, and stable-employment percentage? A property-management company in the area should have these aggregated.
- How much new for-sale + rental construction is in the pipeline within 1–3 miles? Heavy new supply typically softens prices + rents 12–24 months out; constrained supply supports both.
Repairs flagged (vision-AI assessment)
- Moderate: Exterior siding — Weathered and discolored
- Moderate: Kitchen cabinets — Dated appearance
- Moderate: Bathroom fixtures — Dated and worn
- Moderate: Paint — Faded in some areas
CashFlowRE · CFR-NEVP4MCG4FXB67
· Data 3 weeks ago
cashflowre.app · 2026-05-29