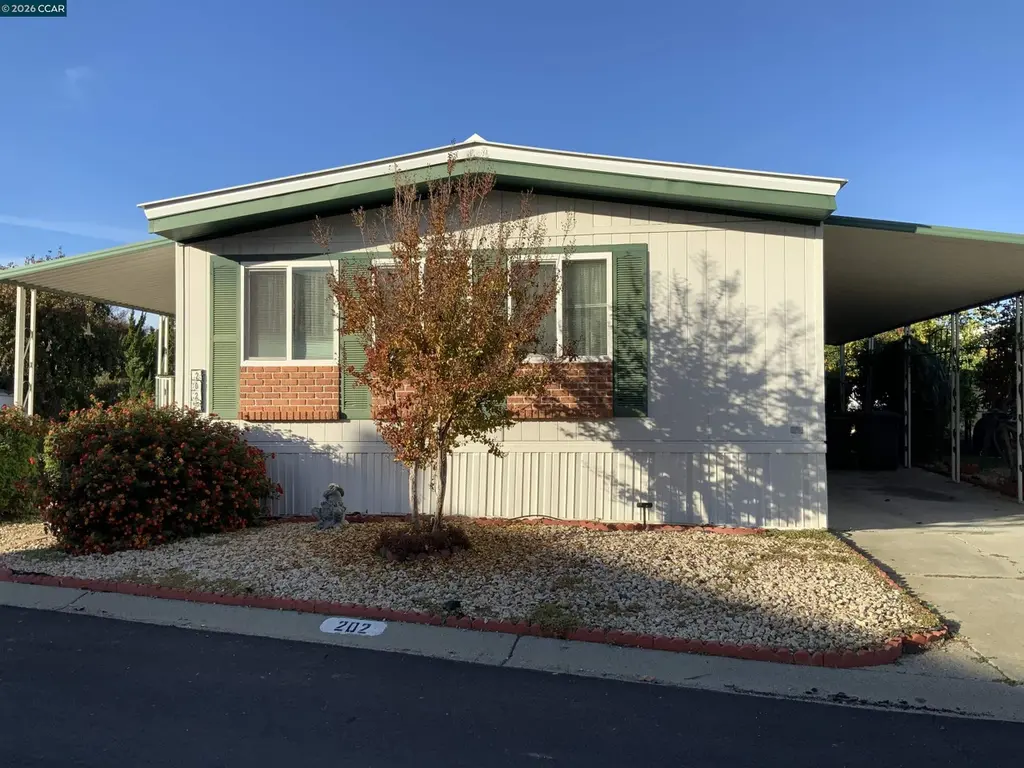
202 Queens Way · Pittsburg, CA
Flood risk 1/10 · Minimal
- FEMA flood zone
- X (unshaded)
- Chance of flooding over 30 yrs
- 0.0%
- Est. flood insurance / yr
- $507 – $1,088
Fire risk 6/10 · Moderate
- Est. fire insurance / yr
- $659 – $1,223
Heat risk 5/10 · Moderate
- Hot days now (above 99°F)
- 7 days/yr
- Hot days in 30 yrs
- 14 days/yr
Wind risk 1/10 · Minimal
- Chance of severe wind over 30 yrs
- —
Air-quality risk 8/10 · Major
- Unhealthy air days now
- 14 days/yr
- Unhealthy air days in 30 yrs
- 14 days/yr
Risk factors via First Street. Map © Google.
Why this score? — see what drove the B+ grade
The composite is a weighted blend of 9 inputs, each scored 0–100. Each bar is that input's sub-score; the figure is the points it added to the 100-point composite (weight × sub-score).
- Cash flow +30.0/30.0
- ARV discount +14.4/15.0
- 1% rule +10.0/10.0
- DSCR +10.0/10.0
- Livability +2.9/5.0
- Rent growth +2.8/5.0
- Schools +2.8/10.0
- Condition / age +2.2/5.0
- Appreciation +0.0/10.0
$73,333
🖨 Deal sheet 📄 Offer letter ✓ Due diligence
Listing remarks
Charming and rich in character, this home is beautifully positioned on a corner lot in a friendly 55+ community, offering a warm, storybook ambiance. Inside, you’ll find two bedrooms and two bathrooms, along with both a separate living room and family room—providing plenty of space for relaxing or entertaining. The kitchen reflects the seller’s artistic touch, featuring details that create a one-of-a-kind feel. It comes equipped with a refrigerator, built-in oven, gas cooktop, and dishwasher, along with a convenient counter-height table ideal for casual dining or morning coffee. Artistic elements continue throughout the home, from the guest bathroom with a shower-over-tub
Key facts
- 2 garage spots
- Community pool
- Built 1978
Property features AI
Finance
- HOA & community: Pets allowed upon approval; Delta Hawaii Mobile Home Park; Senior community; Community amenities: clubhouse, greenbelt, fitness center, pool, sauna, spa, activities, BBQ area, game room, guest parking, rec room with fireplace
Exterior
- Parking: 2 garage spaces; Carport for 2 or more vehicles; 2 covered parking spaces
- Utilities: Public water; Public sewer
- Home design: Manufactured in-park (mobile home); Double wide; Main entry at street level
- Construction: Aluminum siding; Crawl space foundation; Living area approximately 1,248 square feet
- Exterior features: Covered patio/porch; Terraced landscaping; Shed(s); Landscaped corner lot; Community pool
Interior
- Kitchen: Refrigerator
- Bedrooms: 2 bedrooms (street level)
- Flooring: Laminate flooring
- Bathrooms: 2 full bathrooms; Primary bathroom has a stall shower and sunken tub; Other bathroom(s) include shower over tub
- Heating & cooling: Forced air heating; Central air conditioning
- Interior features: No additional rooms; Window coverings; Stair lift
- Laundry & utility: Laundry room with hookups only; Gas water heater
Neighborhood map
What this means for you Summary
Snapshot
- This is a 2-bed/2.0-bath manufactured listed at $73k. Condition is rated fair.
Deal economics
- At list price, monthly cash flow is $2k ($19k/yr) — positive.
- The deal already cash-flows at list — no discount required.
- Meets the 1% rule at list price ($3k rent vs $73k).
- Cap rate 32.0% vs local median 3.4% in Pittsburg — top-decile yield for the area; either an underpriced asset or a hidden risk that comps aren't pricing in. Stress-test before assuming the spread holds.
Location & tenants
- Location reads 58/100 on livability (#687 in CA) — a working-class tenant base; expect higher turnover. Strengths: employment A+, housing A+; Watch: schools F, crime D-, amenities F.
- Pittsburg Unified (suburban): math 21% / reading 35% proficiency, ranked #1,069 of 1,400 in CA (top 76%) — low school quality limits family demand, transient renter base, plan for 1-2y turnover; 66% free/reduced lunch — lower-income household profile, screen leases tightly.
- Market conditions: Rents rising (+1.1%/yr); 265 active listings in the ZIP; 22 comparable units currently listed for rent nearby; rentals at typical pace (median 19d on market — plan ~3-4 weeks tenant-placement turnaround); solid renter incomes; 2,169 units permitted in Contra Costa County in 2024 (896 in 5+ unit buildings).
- This rent runs 33% of the median local income ($96k/yr) — at the standard rent-burdened threshold; future hikes will face affordability resistance.
Forward outlook
- Local home prices are declining (-3.0%/yr); year-one equity from $507 of loan paydown is wiped out by about $2k of value loss. Plan a longer hold.
- Contra Costa County population projected at +26% by 2050 — long-run rental-demand tailwind backs the buy-and-hold thesis.
- At projected returns (-3.0% appreciation + 1.1% rent growth), your $21k cash investment doubles in ~2 years — after that, you're playing with house money.
Negotiation context
- Only 8 days on market — expect competitive offers; lowballing is unlikely to land.
Risks & watch-outs
- Climate carrying-cost: major wildfire risk; extreme-heat days projected 7→14/yr by 2055 (HVAC capex compounding) — expect insurance premiums to compound above CPI over the hold.
Questions for the listing agent
- Have any recent inspections been done? Can we get a copy of the seller's disclosures and any deferred-maintenance estimates?
- Built in 1978 — when were the roof, HVAC, electrical panel, plumbing, and water heater last replaced?
- Is there a deadline driving the sale (1031 exchange, divorce, estate, relocation)? That informs how much negotiation room exists.
- Schools are F-rated, which usually means shorter tenancies and higher turnover. Who's the typical renter profile here, and what's been the actual vacancy rate?
- Crime grade is D in this area — have there been break-ins, vandalism, or insurance claims at this property in the last 3 years? What carrier currently insures it and at what premium?
- What's the average days-on-market for RENTAL listings here right now (not sales)? A rising rental-DOM trend means longer vacancies and softer asking-rent achievability than the comps imply.
- What's the recent tenant-quality profile in this submarket — average credit score on applications, eviction rate, late-payment / NSF rate, and stable-employment percentage? A property-management company in the area should have these aggregated.
- How much new for-sale + rental construction is in the pipeline within 1–3 miles? Heavy new supply typically softens prices + rents 12–24 months out; constrained supply supports both.
Investment metrics
- 1% rule
- 3.59% ✓
- Cap rate
- 32.04%
- Cash-on-cash
- 91.95%
- DSCR
- 5.09
- GRM
- 2.3
CMA / ARV
- ARV (median comp)
- $86,700
- List price
- $73,333
- Delta
- -15.42%
- Verdict
- UNDERPRICED
- Comps
- 18 within 1.0 mi
Show comp detail 12 sales within ~0.75 mi
| Address | Dist | Beds/Ba | Sqft | Sold | Price | $/sf | Match |
|---|---|---|---|---|---|---|---|
| 202 Queens Way | 0.00mi | 2/2.0 | 1,248 (0%) | 1mo | $70,000 | $56 | 100 |
| 171 Sunset Dr | 0.08mi | 2/2.0 | 1,248 (0%) | 11mo | $100,000 | $80 | 87 |
| 201 Queens Way #201 | 0.02mi | 2/2.0 | 1,152 (-8%) | 1mo | $60,000 | $52 | 85 |
| 224 Queens Way #224 | 0.07mi | 2/2.0 | 1,344 (+8%) | 2mo | $85,900 | $64 | 82 |
| 134 Banyon Dr | 0.11mi | 2/2.0 | 1,344 (+8%) | 3mo | $133,000 | $99 | 79 |
| 169 Sunset Way | 0.09mi | 2/2.0 | 1,320 (+6%) | 9mo | $249,500 | $189 | 79 |
| 109 Reef Dr #109 | 0.16mi | 2/2.0 | 1,152 (-8%) | 2mo | $120,000 | $104 | 78 |
| 46 Palm Dr | 0.21mi | 3/2.0 (+1) | 1,277 (+2%) | 6mo | $230,000 | $180 | 77 |
| 232 Queens Way | 0.02mi | 2/2.0 | 1,400 (+12%) | 4mo | $87,500 | $63 | 75 |
| 170 Sunset Way | 0.08mi | 2/2.0 | 1,160 (-7%) | 12mo | $169,500 | $146 | 75 |
| 131 Banyon Dr | 0.14mi | 2/2.0 | 1,100 (-12%) | 2mo | $82,000 | $75 | 72 |
| 61 Pali Way | 0.24mi | 2/2.0 | 1,400 (+12%) | 3mo | $50,000 | $36 | 66 |
Match score weights: distance 35% · size 25% · config 20% · recency 20%. Top-matched comps best support the ARV.
Projected returns pro-forma
-3.0% appreciation · 1.11% rent growth · sell at horizon
- IRR
- 90.6%
- Equity multiple
- 5.06×
- Total profit
- $83,454
- Equity at exit
- $10,934
- IRR
- 93.1%
- Equity multiple
- 9.89×
- Total profit
- $182,455
- Equity at exit
- $6,340
Cash invested: $20,533 (down + closing). Projections, not guarantees.
Landlord ↔ Tenant lean methodology
- Overall (STATE)
- 18 Strongly Tenant-Friendly
- State California
- 18 Strongly Tenant-Friendly · D+13
- County
- — inherits STATE
- City
- — inherits STATE
ZIP-level market 94565
- Rents YoY
- 1.1%
- Active inventory
- 265
- Price-to-rent
- 2.3×
Monthly cashflow live
- Estimated rent
- $2,633 high interval (Pro) →
- Mortgage (P&I)
- −$385
- Tax est. 1.5%
- −$92 /mo · $1,100/yr
- Insurance
- −$31
- HOA
- −$0
- Vacancy / Maint / Mgmt
- −$553
- Net cashflow
- $1,573
Break-even live
UW: 25.0% down · 7.5% · 30yr · 1.5% tax · 5.0% vac · 8.0% maint · 8.0% mgmt
Financing live
Cash to close
- Down payment
- $18,333
- Closing costs
- $2,200
- Reserves months
- —
- Total cash needed
- —
Loan-product check · same deal, 3 products live
Conventional
25% down · 7.5% · 30yr
- Down + closing
- —
- Monthly P&I
- —
- Monthly cashflow
- —
- DSCR
- —
- Eligible?
- —
Personal DTI + credit; lowest rate.
DSCR
20% down · 8.5% · 30yr
- Down + closing
- —
- Monthly P&I
- —
- Monthly cashflow
- —
- DSCR
- —
- Eligible?
- —
No personal income docs; deal must DSCR.
Hard money
10% down · 12.0% · 12mo
- Down + closing
- —
- Monthly P&I
- —
- Monthly cashflow
- —
- DSCR
- —
- Eligible?
- —
Short-term bridge; refi at stabilization.
Rent comps 22 comps
| Address | Beds | Baths | Sqft | Rent | $/sqft | DOM | Units | Dist |
|---|---|---|---|---|---|---|---|---|
| 4 Meadowbrook Ave Pittsburg, CA | 2.0 | 2.0 | 1122 | $2,600 | $2.32 | 43d | 1 | 0.19mi |
| 3818 Harbor St Pittsburg, CA | 2.0 | 1.0 | 825 | $2,350 | $2.85 | 3d | 1 | 0.31mi |
| 948 Golden Leaf Way Pittsburg, CA | 3.0 | 2.0 | 1386 | $3,400 | $2.45 | 43d | 1 | 0.31mi |
| 2221 Lynbrook Dr Pittsburg, CA | 3.0 | 2.0 | 1365 | $3,195 | $2.34 | 43d | 1 | 0.36mi |
| 1128 E Leland Rd Pittsburg, CA | 1.0–2.0 | 1.0 | 758 | $2,245 | $2.96 | 2d | 11 | 0.43mi |
| 500 Loveridge Cir Pittsburg, CA | 1.0–3.0 | 1.0–2.0 | 825 | $2,430 | $2.95 | 1d | 10 | 0.52mi |
| 110 Dias Cir Pittsburg, CA | 1.0–3.0 | 1.0–2.0 | 819 | $2,385 | $2.91 | 1d | 15 | 0.54mi |
| 17 Lorraine Ave Pittsburg, CA | 3.0 | 1.5 | 1180 | $2,700 | $2.29 | 18d | 1 | 0.74mi |
| 240 Benjamin Ave Pittsburg, CA | 3.0 | 2.0 | 1379 | $3,139 | $2.28 | 2d | 1 | 0.75mi |
| 30 Castlewood Dr Pittsburg, CA | 1.0–2.0 | 1.0 | 793 | $2,640 | $3.33 | 1d | 3 | 0.95mi |
| 1680 Barrus Ave Pittsburg, CA | 2.0 | 1.0 | 850 | $2,300 | $2.71 | 24d | 1 | 1.00mi |
| 1373 Columbia St Pittsburg, CA | 1.0 | 1.0 | 736 | $1,900 | $2.58 | 43d | 1 | 1.09mi |
| 2205 E Leland Rd Pittsburg, CA | 1.0–2.0 | 1.0–2.0 | 847 | $2,359 | $2.79 | 1d | 20 | 1.10mi |
| 1000 Pheasant Dr Pittsburg, CA | 1.0–2.0 | 1.0–2.5 | 879 | $2,795 | $3.18 | 24d | 29 | 1.10mi |
| 1353 Pine St Pittsburg, CA | 3.0 | 2.0 | 1369 | $2,750 | $2.01 | 5d | 1 | 1.12mi |
| 1341 Maple St Pittsburg, CA | 2.0 | 1.0 | 1299 | $2,550 | $1.96 | 21d | 1 | 1.13mi |
| 241 W Buchanan Rd Pittsburg, CA | 1.0–2.0 | 1.0–2.0 | 840 | $2,660 | $3.17 | 1d | 13 | 1.15mi |
| 1346 Redwood St Pittsburg, CA | 3.0 | 1.5 | 1066 | $2,915 | $2.73 | 16d | 1 | 1.15mi |
| 2191 Lakeview Cir Pittsburg, CA | 2.0 | 2.0 | 783 | $2,500 | $3.19 | 16d | 1 | 1.21mi |
| 535 Central Ave Unit 2 Pittsburg, CA | 1.0 | 1.0 | 700 | $1,795 | $2.56 | 43d | 1 | 1.22mi |
| 706 E 12th St Pittsburg, CA | 2.0 | 1.0 | 939 | $2,490 | $2.65 | 24d | 1 | 1.23mi |
| 706 E 12th St Pittsburg, CA | 2.0 | 1.0 | 935 | $2,490 | $2.66 | 21d | 1 | 1.23mi |
Listing history 2 events
-
2026-05-14status Pending 1292-char remark
-
2026-05-05$73,333 Active 1292-char remark
ⓘ Source: listings_history table (triggers on properties + properties_extension) + one-shot
backfill from property_details.listing_events for pre-trigger history.
Climate risk First Street
- Flood 1/10 Low FEMA zone X (unshaded) · 0% chance over 30 yrs
- Wildfire 6/10 Major
- Heat 5/10 Major 7 d/yr ≥99°F today · 14 d/yr by 30 yrs out
- Wind 1/10 Low
- Air quality 8/10 Severe 14 unhealthy d/yr today · 14 by 30 yrs out
Nearby sold comps map
Loading sold comps map…
Walkable amenities ~0.75 mi
Loading nearby amenities…
Taxation est. · year 1
- Rental income
- $31,598
- − Mortgage interest
- −$4,108
- − Property taxes
- −$1,100
- − Insurance
- −$367
- − Repairs & maintenance
- −$2,528
- − Management
- −$2,528
- − Depreciation
- −$2,133
- Taxable income
- $18,835
- Est. tax owed @ 24.0%
- −$4,520
- After-tax cash flow
- $14,361/yr
For passive investors: Depreciation is non-cash, so a rental often shows a tax loss while cash-flowing — sheltering income. Rental losses are passive: they offset passive income freely, and up to $25,000/yr can offset ordinary (W-2) income if you actively participate and your MAGI is under $100k (phasing out to $0 by $150k); unused losses carry forward. On sale, claimed depreciation is recaptured at up to 25%, and gains may owe capital-gains tax (a 1031 exchange can defer both). Figures are a year-1 estimate at your 24.0% rate — not tax advice; consult a CPA.
Condition & rehab AI · 12 photos
This charming manufactured home in a 55+ community requires moderate repairs and updates to improve its condition and value. Painting, updating cabinets and fixtures, and landscaping improvements would significantly enhance its appeal.
Repairs flagged
- Moderate Exterior siding — Weathered and discolored
- Moderate Kitchen cabinets — Dated appearance
- Moderate Bathroom fixtures — Dated and worn
- Moderate Paint — Faded in some areas
Value-add opportunities
- Both Painting and updating kitchen cabinets — Improves curb appeal and interior aesthetics
- Both Updating bathroom fixtures — Enhances functionality and appeal
- Both Landscaping improvements — Enhances curb appeal and property value
Renovation cost estimate screening
| Repair item | Severity | Est. cost |
|---|---|---|
| Exterior siding · Weathered and discolored | Moderate | $3,000–15,000 |
| Kitchen cabinets · Dated appearance | Moderate | $3,000–15,000 |
| Bathroom fixtures · Dated and worn | Moderate | $3,000–15,000 |
| Paint · Faded in some areas | Moderate | $3,000–15,000 |
| Total estimated repair cost · 4 items | $12,000–60,000 |
Value-add ROI direction
- Both Painting and updating kitchen cabinets — Improves curb appeal and interior aesthetics ↑
- Both Updating bathroom fixtures — Enhances functionality and appeal ↑
- Both Landscaping improvements — Enhances curb appeal and property value ↑
ⓘ Cost ranges are severity-bucket heuristics (US national rule-of-thumb). Get contractor quotes + a written scope before underwriting a rehab budget.
Schools (NCES district)
- District
- Pittsburg Unified
- NCES district ID
- 0630600
- Math proficiency
- 21% ▲ 1.00%
- Reading proficiency
- 35% ▲ 1.00%
- Median HH income
- $55,872
- Composite
- 27.99/100
- National rank
- #12238
- State rank
- #1069 of 1400 in CA
Livability — Pittsburg
- Score
- 58/100
- State rank
- #687
- US rank
- #20922
Category grades
Schools grade is shown separately in the Schools card above.
Census & demographics
- Census place
- Pittsburg, CA
- County
- Contra Costa County · 1,059,880 people
- City population
- 100,488
- Metro
- San Francisco-Oakland-Berkeley, CA
- Population (ZIP)
- 100,488
- Household income
- $95,556
- Rent vs Own
- Severe rent burden
- 3942.0
Population outlook (Contra Costa County) Hauer SSP2
- Today (2025)
- 1,287,720 people
- By 2030
- 1,364,937 · +6.0%
- By 2040
- 1,506,209 · +17.0%
- By 2050
- 1,624,373 · +26.1%
- By 2075
- 1,853,193 · +43.9%
- By 2100
- 1,901,231 · +47.6%
Race, ethnicity, and origin ACS 2023
- Neighborhood character
- Diverse neighborhood (Simpson 0.70)
- Race & ethnicity
- Hispanic / Latino 48% Two or more races 19% Asian 17% White 16% Black 13% Pacific Islander 1% Native American 1%
- Hispanic origin (detail)
- Mexican 38% Puerto Rican 1%
- Common ancestry
- Italian 1% Russian 1% Lithuanian 1%
- Foreign-born
- 34% · Canada, China, Vietnam
- Languages at home
- 47% English-only · Spanish 37% Tagalog/Filipino 6% Other Indo-European 4%
Political lean MEDSL · Contra Costa
- 2024 margin
- Solid D (+38.0) · D 67.3% · R 29.4% · Other 3.3%
- 2008→2024 swing
- +0.2pp no change · 2008: 37.8pp · 2024: 38.0pp
- All cycles
- 2024: D+38.0 2020: D+45.3 2016: D+43.5 2012: D+33.7 2008: D+37.8
Not yet ingested
- Civics
- —
Market trends
- HPI YoY
- ▼ -478.40%
- Current HPI
- 376.2576
- Rent YoY
- ▲ 1.11%
- Metro
- San Francisco-Oakland-Berkeley, CA
- State GDP YoY
- ▲ 3.21%
- F500 in state
- 116
Industry mix (Fortune 500 HQ in CA)
| Industry | F500 HQs | Revenue |
|---|---|---|
| Technology | 27 | $1,492B |
|
||
| Financial Services | 3 | $174B |
|
||
| Retail | 3 | $44B |
|
||
| Insurance | 3 | $26B |
|
||
| Media / Entertainment | 2 | $115B |
|
||
| Pharmaceuticals / Biotech | 2 | $62B |
|
||
Price history
-4.5% since first listed3 events — show timeline
- 2026-06-01 Sold (MLS) $70,000 bridgeMLS, Bay East AOR, or Contra Costa AOR
- 2026-05-14 Pending — bridgeMLS, Bay East AOR, or Contra Costa AOR
- 2026-05-05 Listed $73,333 bridgeMLS, Bay East AOR, or Contra Costa AOR
Cash-flow waterfall
monthlySold comps — $/sqft
last 12 mo · ≤1 miLoading sold comps…