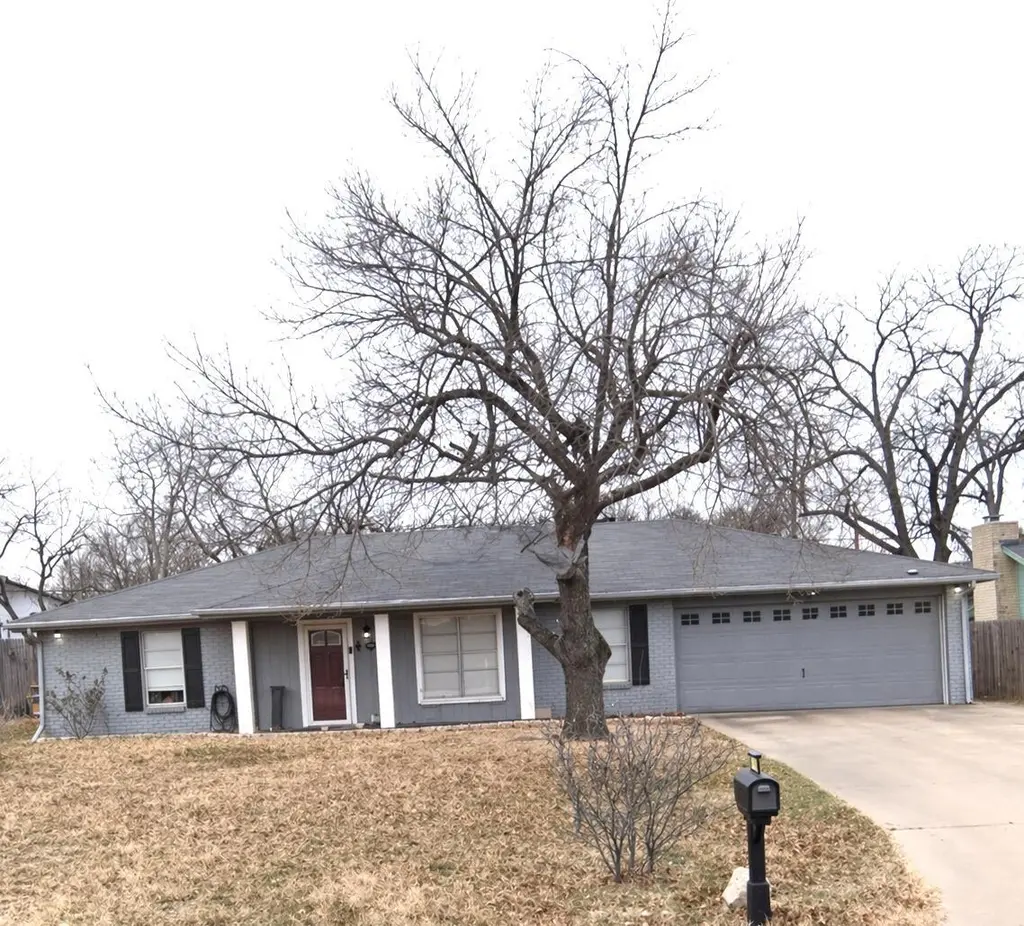
1905 N Van Buren St
San Angelo, TX 76901
$189,900C
3 bd · 2.0 ba ·
2,190 sqft ·
Built 1968
· SingleFamily
· Active
· 64 DOM
Cashflow @ list (25.0% down · 7.5%)
Estimated rent
$1,845/mo
Mortgage (P&I)
−$996
Tax + insurance
−$509
HOA
−$0
Vac / Maint / Mgmt
−$387
Net cashflow
$-47/mo
Annual
$-563/yr
Cap rate
6.00%
Cash-on-cash
-1.06%
DSCR
0.95
1% rule
0.97%
Cash to close
$53,172
Investor read
- This is a 3-bed/2.0-bath single-family listed at $190k.
- At list price, monthly cash flow is $-47 ($-563/yr) — negative.
- To cash-flow at today's rent, offer at most $182k (4.4% below list).
- To meet the 1% rule (rent ≥ 1% of price), the offer needs to be $185k (2.8% below list).
- It's been on market 64 days — a 6% lower offer ($179k) is reasonable based on typical stale-listing flexibility.
- Recommended offer: $179k (6.0% below list) — sets the bar for market timing.
- In year one you build about $20k of equity ($1k loan paydown + $19k appreciation (10.0% local appreciation)).
- Location reads 73/100 on livability (#199 in TX) — a middle-class / working-renter tenant base. Strengths: cost of living A+, housing A+, health & safety A+; Watch: employment C-, schools F, amenities F.
- San Angelo ISD (urban): math 27% / reading 33% proficiency, ranked #627 of 826 in TX (top 76%) — families likely to look elsewhere, expect single-tenant / working-renter base with shorter leases.
- Watch-outs: property tax is 2.7% of price.
- Market conditions: Rents rising fast (+5.8%/yr); 331 active listings in the ZIP; 4 comparable units currently listed for rent nearby; rentals lingering (median 44d on market — plan ~5-8 weeks vacancy on turnover, expect pricing pressure); 50% of comp listings sitting > 30 days — soft ceiling on asking rent; 233 units permitted in Tom Green County in 2024 (0 in 5+ unit buildings).
- Tom Green County population projected at +35% by 2050 — long-run rental-demand tailwind backs the buy-and-hold thesis.
- 4 sale attempts since 16y ago; this cycle's ask has dropped $25k (12%) from the opening price — seller is motivated, your offer sets the floor, not the list.
- At projected returns (10.0% appreciation + 5.8% rent growth), your $53k cash investment doubles in ~3 years — after that, you're playing with house money.
- By year 2, paydown + projected appreciation supports a ~$33k cash-out refi (75% LTV) — recoverable capital for the next deal without selling this one.
- Climate carrying-cost: major wildfire risk; extreme-heat days projected 7→23/yr by 2055 (HVAC capex compounding) — expect insurance premiums to compound above CPI over the hold.
- Cap rate 6.0% vs local median 3.8% in San Angelo — top-decile yield for the area; either an underpriced asset or a hidden risk that comps aren't pricing in. Stress-test before assuming the spread holds.
- This rent runs 32% of the median local income ($69k/yr) — at the standard rent-burdened threshold; future hikes will face affordability resistance.
Questions for listing agent
- What do current leases actually rent for vs. the listed asking? Can we see a recent rent roll and the last 12 months of T-12 income?
- It's been on market 64 days. Have you received any prior offers? Is the seller open to a 6% concession, seller financing, or rate buy-down credit?
- Built in 1968 — when were the roof, HVAC, electrical panel, plumbing, and water heater last replaced?
- Property tax is high relative to price — has the assessment been appealed recently, and will the sale trigger a re-assessment?
- Why hasn't it sold? Are there any deal-killer items the seller is aware of (foundation, flood, title, zoning, code violations)?
- Is there a deadline driving the sale (1031 exchange, divorce, estate, relocation)? That informs how much negotiation room exists.
- Schools are F-rated, which usually means shorter tenancies and higher turnover. Who's the typical renter profile here, and what's been the actual vacancy rate?
- What's the average days-on-market for RENTAL listings here right now (not sales)? A rising rental-DOM trend means longer vacancies and softer asking-rent achievability than the comps imply.
CashFlowRE · CFR-NF7AESCY32M0KB
· Data 1 day ago
cashflowre.app · 2026-05-29