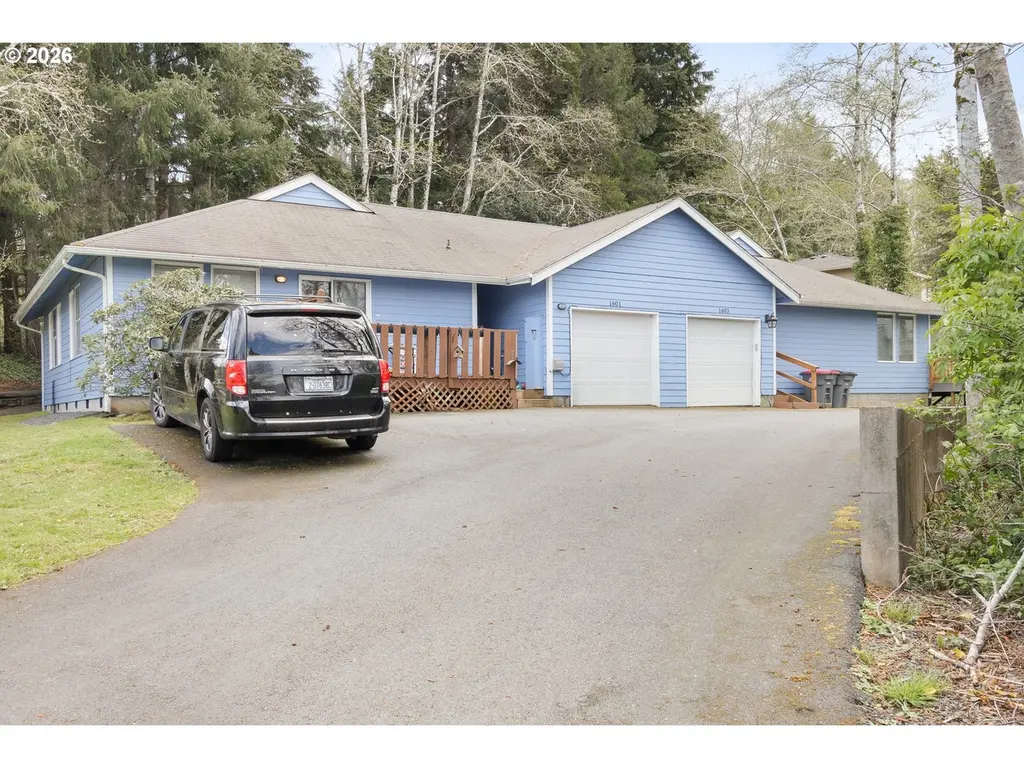
1601 Spruce Dr
Seaside, OR 97138
$650,000F
6 bd · 4.0 ba ·
2,192 sqft ·
Built 1996
· SingleFamily
· Pending
· 26 DOM
Cashflow @ list (25.0% down · 7.5%)
Estimated rent
$2,872/mo
Mortgage (P&I)
−$3,409
Tax + insurance
−$666
HOA
−$0
Vac / Maint / Mgmt
−$603
Net cashflow
$-1,806/mo
Annual
$-21,668/yr
Cap rate
2.96%
Cash-on-cash
-11.91%
DSCR
0.47
1% rule
0.44%
Cash to close
$182,000
Investor read
- This is a 6-bed/4.0-bath single-family listed at $650k.
- At list price, monthly cash flow is $-2k ($-22k/yr) — negative.
- To cash-flow at today's rent, offer at most $331k (49.1% below list).
- To meet the 1% rule (rent ≥ 1% of price), the offer needs to be $287k (55.8% below list).
- It's been on market 26 days — a 2% lower offer ($640k) is reasonable based on typical stale-listing flexibility.
- Recommended offer: $287k (55.8% below list) — sets the bar for 1% rule.
- In year one you build about $69k of equity ($4k loan paydown + $65k appreciation (10.0% local appreciation)).
- Location reads 79/100 on livability (#60 in OR, #2,085 nationally) — a middle-class / working-renter tenant base. Strengths: amenities A+, commute A+, health & safety A+; Watch: employment C-, crime D+, cost of living D+.
- Seaside SD 10 (town): math 11% / reading 41% proficiency, ranked #53 of 58 in OR (top 91%) — low school quality limits family demand, transient renter base, plan for 1-2y turnover.
- Market conditions: 226 active listings in the ZIP; 1 comparable units currently listed for rent nearby; 98 units permitted in Clatsop County in 2024 (0 in 5+ unit buildings).
- 4 sale attempts since 10y ago with the ask held roughly flat each time — persistent listings suggest the price (not the market) is what's stuck; bring a comps-based counter.
- Current owner paid $360k; list at $650k implies a 81% gain — meaningful room to come down on a strong offer.
- By year 2, paydown + projected appreciation supports a ~$112k cash-out refi (75% LTV) — recoverable capital for the next deal without selling this one.
- Cap rate 3.0% vs local median 2.5% in Seaside — meaningfully above typical; check what's discounted (condition, days-on-market, listing class) to confirm the premium yield is real.
- At $2,872/mo this rent would consume 57% of the median local household income ($60k/yr) (locally 573% of renters already pay >50% of income on rent) — very limited rent-growth headroom before tenants either downsize or default.
Questions for listing agent
- What do current leases actually rent for vs. the listed asking? Can we see a recent rent roll and the last 12 months of T-12 income?
- Is there a deadline driving the sale (1031 exchange, divorce, estate, relocation)? That informs how much negotiation room exists.
- Schools are D-rated, which usually means shorter tenancies and higher turnover. Who's the typical renter profile here, and what's been the actual vacancy rate?
- Crime grade is D in this area — have there been break-ins, vandalism, or insurance claims at this property in the last 3 years? What carrier currently insures it and at what premium?
- The area grade is low — what's the realistic commute time and amenity access for the typical tenant pool here? Any planned neighborhood developments (good or bad) we should know about?
- What's the average days-on-market for RENTAL listings here right now (not sales)? A rising rental-DOM trend means longer vacancies and softer asking-rent achievability than the comps imply.
- What's the recent tenant-quality profile in this submarket — average credit score on applications, eviction rate, late-payment / NSF rate, and stable-employment percentage? A property-management company in the area should have these aggregated.
- How much new for-sale + rental construction is in the pipeline within 1–3 miles? Heavy new supply typically softens prices + rents 12–24 months out; constrained supply supports both.
CashFlowRE · CFR-NFYCA0776PKFN6
· Data 6 days ago
cashflowre.app · 2026-05-29