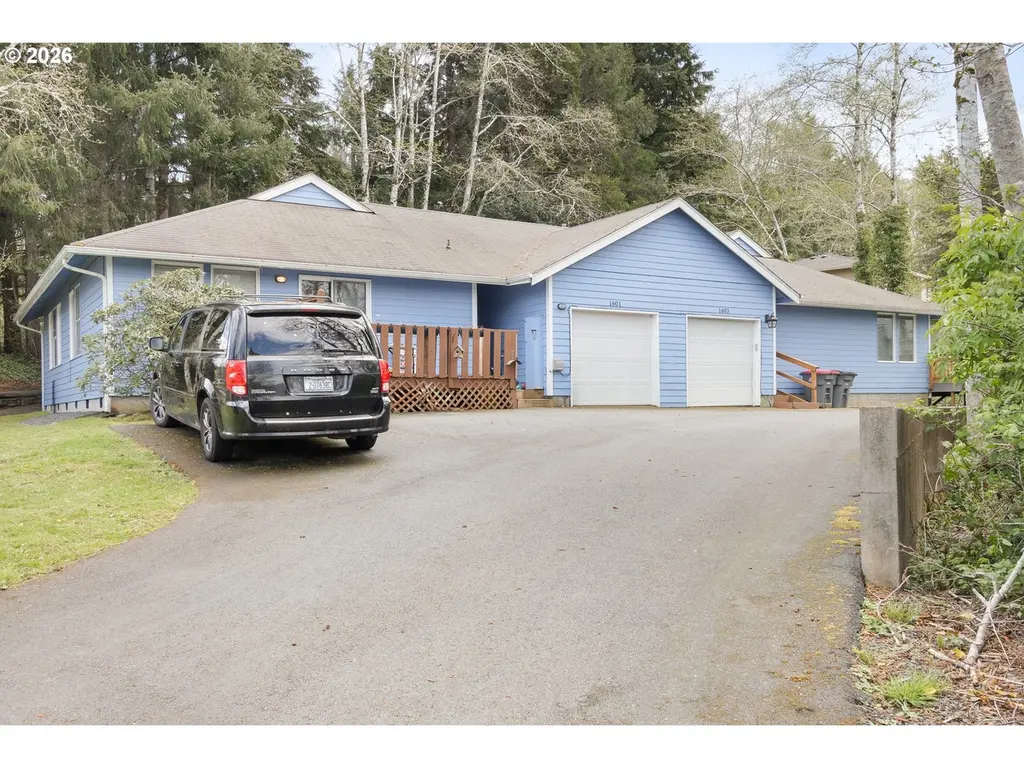
1601 Spruce Dr · Seaside, OR
Flood risk 1/10 · Minimal
- FEMA flood zone
- X (unshaded)
- Chance of flooding over 30 yrs
- 0.0%
- Est. flood insurance / yr
- $507 – $1,088
Fire risk 1/10 · Minimal
- Est. fire insurance / yr
- $498 – $926
Heat risk 1/10 · Minimal
- Hot days now (above 77°F)
- 7 days/yr
- Hot days in 30 yrs
- 14 days/yr
Wind risk 1/10 · Minimal
- Chance of severe wind over 30 yrs
- —
Air-quality risk 6/10 · Moderate
- Unhealthy air days now
- 6 days/yr
- Unhealthy air days in 30 yrs
- 6 days/yr
Risk factors via First Street. Map © Google.
Why this score? — see what drove the F grade
The composite is a weighted blend of 9 inputs, each scored 0–100. Each bar is that input's sub-score; the figure is the points it added to the 100-point composite (weight × sub-score).
- Appreciation +10.0/10.0
- Cash flow +4.0/30.0
- Livability +4.0/5.0
- Rent growth +2.5/5.0
- Condition / age +2.5/5.0
- Schools +2.2/10.0
- ARV discount +0.6/15.0
- 1% rule +0.0/10.0
- DSCR +0.0/10.0
$650,000
🖨 Deal sheet 📄 Offer letter ✓ Due diligence
Listing remarks MLS
Prime Seaside Duplex + Portfolio Opportunity. Excellent opportunity to acquire a high-performing, cash-flowing duplex in a high-demand coastal rental market. Fully occupied with reliable in-place income and straightforward operations. Instant Scale: Looking for a larger footprint? This property is part of a larger release and can be purchased individually or seamlessly packaged with two Warrenton 4-plexes for a dominant 10-unit coastal portfolio. Drive-by only; please DO NOT DISTURB tenants under any circumstances. Interior showings will be scheduled upon an accepted offer. Note: Seller is a licensed Oregon real estate broker.
Key facts
- 0.31 acre lot
- Garage
- Built 1996
Neighborhood map
What this means for you Summary
Snapshot
- This is a 6-bed/4.0-bath single-family listed at $650k.
Deal economics
- At list price, monthly cash flow is $-2k ($-22k/yr) — negative.
- To cash-flow at today's rent, offer at most $331k (49.1% below list).
- To meet the 1% rule (rent ≥ 1% of price), the offer needs to be $287k (55.8% below list).
- Recommended offer: $287k (55.8% below list) — sets the bar for 1% rule.
- Cap rate 3.0% vs local median 2.5% in Seaside — meaningfully above typical; check what's discounted (condition, days-on-market, listing class) to confirm the premium yield is real.
Location & tenants
- Location reads 79/100 on livability (#60 in OR, #2,085 nationally) — a middle-class / working-renter tenant base. Strengths: amenities A+, commute A+, health & safety A+; Watch: employment C-, crime D+, cost of living D+.
- Seaside SD 10 (town): math 11% / reading 41% proficiency, ranked #53 of 58 in OR (top 91%) — low school quality limits family demand, transient renter base, plan for 1-2y turnover.
- Market conditions: 226 active listings in the ZIP; 1 comparable units currently listed for rent nearby; 98 units permitted in Clatsop County in 2024 (0 in 5+ unit buildings).
- At $2,872/mo this rent would consume 57% of the median local household income ($60k/yr) (locally 573% of renters already pay >50% of income on rent) — very limited rent-growth headroom before tenants either downsize or default.
Forward outlook
- In year one you build about $69k of equity ($4k loan paydown + $65k appreciation (10.0% local appreciation)).
- By year 2, paydown + projected appreciation supports a ~$112k cash-out refi (75% LTV) — recoverable capital for the next deal without selling this one.
Negotiation context
- It's been on market 26 days — a 2% lower offer ($640k) is reasonable based on typical stale-listing flexibility.
- 4 sale attempts since 10y ago with the ask held roughly flat each time — persistent listings suggest the price (not the market) is what's stuck; bring a comps-based counter.
- Current owner paid $360k; list at $650k implies a 81% gain — meaningful room to come down on a strong offer.
Questions for the listing agent
- What do current leases actually rent for vs. the listed asking? Can we see a recent rent roll and the last 12 months of T-12 income?
- Is there a deadline driving the sale (1031 exchange, divorce, estate, relocation)? That informs how much negotiation room exists.
- Schools are D-rated, which usually means shorter tenancies and higher turnover. Who's the typical renter profile here, and what's been the actual vacancy rate?
- Crime grade is D in this area — have there been break-ins, vandalism, or insurance claims at this property in the last 3 years? What carrier currently insures it and at what premium?
- The area grade is low — what's the realistic commute time and amenity access for the typical tenant pool here? Any planned neighborhood developments (good or bad) we should know about?
- What's the average days-on-market for RENTAL listings here right now (not sales)? A rising rental-DOM trend means longer vacancies and softer asking-rent achievability than the comps imply.
- What's the recent tenant-quality profile in this submarket — average credit score on applications, eviction rate, late-payment / NSF rate, and stable-employment percentage? A property-management company in the area should have these aggregated.
- How much new for-sale + rental construction is in the pipeline within 1–3 miles? Heavy new supply typically softens prices + rents 12–24 months out; constrained supply supports both.
Investment metrics
- 1% rule
- 0.44% ✗
- Cap rate
- 2.96%
- Cash-on-cash
- -11.91%
- DSCR
- 0.47
- GRM
- 18.9
CMA / ARV
- ARV (median comp)
- $563,188
- List price
- $650,000
- Delta
- 15.41%
- Verdict
- OVERPRICED
- Comps
- 12 within 1.0 mi
Show comp detail 1 sale within ~0.75 mi
| Address | Dist | Beds/Ba | Sqft | Sold | Price | $/sf | Match |
|---|---|---|---|---|---|---|---|
| 1255 Avenue A Unit 1 and 2 | 0.50mi | 5/3.0 (-1) | 1,981 (-10%) | 2mo | $641,500 | $324 | 50 |
Match score weights: distance 35% · size 25% · config 20% · recency 20%. Top-matched comps best support the ARV.
Projected returns pro-forma
10.0% appreciation · 3.0% rent growth · sell at horizon
- IRR
- 15.9%
- Equity multiple
- 2.31×
- Total profit
- $238,788
- Equity at exit
- $585,571
- IRR
- 15.4%
- Equity multiple
- 5.36×
- Total profit
- $793,207
- Equity at exit
- $1,262,807
Cash invested: $182,000 (down + closing). Projections, not guarantees.
Landlord ↔ Tenant lean methodology
- Overall (STATE)
- 28 Tenant-Leaning
- State Oregon
- 28 Tenant-Leaning · D+6
- County
- — inherits STATE
- City
- — inherits STATE
ZIP-level market 97138
- Home prices YoY
- 2.6%
- Active inventory
- 226
- Price-to-rent
- 18.9×
Monthly cashflow live
- Estimated rent
- $2,872 medium interval (Pro) →
- Mortgage (P&I)
- −$3,409
- Tax from tax record
- −$395 /mo · $4,741/yr
- Insurance
- −$271
- HOA
- −$0
- Vacancy / Maint / Mgmt
- −$603
- Net cashflow
- $-1,806
Break-even live
UW: 25.0% down · 7.5% · 30yr · 1.5% tax · 5.0% vac · 8.0% maint · 8.0% mgmt
Financing live
Cash to close
- Down payment
- $162,500
- Closing costs
- $19,500
- Reserves months
- —
- Total cash needed
- —
Loan-product check · same deal, 3 products live
Conventional
25% down · 7.5% · 30yr
- Down + closing
- —
- Monthly P&I
- —
- Monthly cashflow
- —
- DSCR
- —
- Eligible?
- —
Personal DTI + credit; lowest rate.
DSCR
20% down · 8.5% · 30yr
- Down + closing
- —
- Monthly P&I
- —
- Monthly cashflow
- —
- DSCR
- —
- Eligible?
- —
No personal income docs; deal must DSCR.
Hard money
10% down · 12.0% · 12mo
- Down + closing
- —
- Monthly P&I
- —
- Monthly cashflow
- —
- DSCR
- —
- Eligible?
- —
Short-term bridge; refi at stabilization.
Rent comps 1 comps
| Address | Beds | Baths | Sqft | Rent | $/sqft | DOM | Units | Dist |
|---|---|---|---|---|---|---|---|---|
| 640 S Columbia St Unit 1335290P Seaside, OR | 5.0 | 3.0 | 2647 | $10,453 | $3.95 | 43d | 1 | 0.83mi |
Listing history 10 events
-
2026-05-06status Pending 634-char remark
Show marketing remark (634 chars)
Prime Seaside Duplex + Portfolio Opportunity. Excellent opportunity to acquire a high-performing, cash-flowing duplex in a high-demand coastal rental market. Fully occupied with reliable in-place income and straightforward operations. Instant Scale: Looking for a larger footprint? This property is part of a larger release and can be purchased individually or seamlessly packaged with two Warrenton 4-plexes for a dominant 10-unit coastal portfolio. Drive-by only; please DO NOT DISTURB tenants under any circumstances. Interior showings will be scheduled upon an accepted offer. Note: Seller is a licensed Oregon real estate broker.
-
2026-04-10$650,000 Active 634-char remark
Show marketing remark (634 chars)
Prime Seaside Duplex + Portfolio Opportunity. Excellent opportunity to acquire a high-performing, cash-flowing duplex in a high-demand coastal rental market. Fully occupied with reliable in-place income and straightforward operations. Instant Scale: Looking for a larger footprint? This property is part of a larger release and can be purchased individually or seamlessly packaged with two Warrenton 4-plexes for a dominant 10-unit coastal portfolio. Drive-by only; please DO NOT DISTURB tenants under any circumstances. Interior showings will be scheduled upon an accepted offer. Note: Seller is a licensed Oregon real estate broker.
-
2018-06-21soldstatus $359,900
-
2018-06-21soldstatus $359,900
-
2018-01-30$359,900
-
2016-12-02soldstatus $233,000
-
2016-12-02soldstatus $233,000
-
2016-12-02soldstatus $119,065
-
2016-05-22$219,000
-
2016-05-16$219,000
ⓘ Source: listings_history table (triggers on properties + properties_extension) + one-shot
backfill from property_details.listing_events for pre-trigger history.
Tax reassessment forecast OR · Resets to sale price
- Current annual tax
- $4,741 · $395/mo
- Projected year-2 tax
- $6,305 · $525/mo
- Expected delta
- +$1,564/yr (+$130/mo · 33.0%)
ⓘ Screening estimate from a state-policy table — verify with the county assessor before closing.
Climate risk First Street
- Flood 1/10 Low FEMA zone X (unshaded) · 0% chance over 30 yrs
- Wildfire 1/10 Low
- Heat 1/10 Low 7 d/yr ≥77°F today · 14 d/yr by 30 yrs out
- Wind 1/10 Low
- Air quality 6/10 Major 6 unhealthy d/yr today · 6 by 30 yrs out
Nearby sold comps map
Loading sold comps map…
Walkable amenities ~0.75 mi
Loading nearby amenities…
Taxation est. · year 1
- Rental income
- $34,464
- − Mortgage interest
- −$36,410
- − Property taxes
- −$4,741
- − Insurance
- −$3,250
- − Repairs & maintenance
- −$2,757
- − Management
- −$2,757
- − Depreciation
- −$18,909
- Taxable loss
- −$34,360
- Est. tax savings @ 24.0%
- +$8,246
- After-tax cash flow
- $-13,422/yr
For passive investors: Depreciation is non-cash, so a rental often shows a tax loss while cash-flowing — sheltering income. Rental losses are passive: they offset passive income freely, and up to $25,000/yr can offset ordinary (W-2) income if you actively participate and your MAGI is under $100k (phasing out to $0 by $150k); unused losses carry forward. On sale, claimed depreciation is recaptured at up to 25%, and gains may owe capital-gains tax (a 1031 exchange can defer both). Figures are a year-1 estimate at your 24.0% rate — not tax advice; consult a CPA.
Schools (NCES district)
- District
- Seaside SD 10
- NCES district ID
- 4111100
- Math proficiency
- 11% ▼ -18.00%
- Reading proficiency
- 41% ▼ -4.00%
- Median HH income
- $43,956
- Composite
- 22.19/100
- National rank
- #8159
- State rank
- #53 of 58 in OR
Livability — Seaside
- Score
- 79/100
- State rank
- #60
- US rank
- #2085
Category grades
Schools grade is shown separately in the Schools card above.
Census & demographics
- Census place
- Seaside, OR
- County
- Clatsop County · 29,028 people
- Metro
- Astoria, OR
- Population (ZIP)
- 11,035
- Household income
- $60,411
- Rent vs Own
- Severe rent burden
- 573.0
Population outlook (Clatsop County) Hauer SSP2
- Today (2025)
- 39,212 people
- By 2030
- 39,765 · +1.4%
- By 2040
- 40,121 · +2.3%
- By 2050
- 40,032 · +2.1%
- By 2075
- 39,123 · -0.2%
- By 2100
- 35,965 · -8.3%
Race, ethnicity, and origin ACS 2023
- Neighborhood character
- Predominantly White (89%)
- Race & ethnicity
- White 89% Hispanic / Latino 7% Two or more races 5% Black 1% Asian 1%
- Hispanic origin (detail)
- Mexican 4% Puerto Rican 1%
- Common ancestry
- Lithuanian 5% Portuguese 3% Scottish 3%
- Foreign-born
- 3% · Canada, China
- Languages at home
- 95% English-only · Spanish 3% German/W. Germanic 1%
Political lean MEDSL · Clatsop
- 2024 margin
- D (+11.4) · D 54.1% · R 42.8% · Other 3.1%
- 2008→2024 swing
- -7.6pp toward R · 2008: 18.9pp · 2024: 11.4pp
- All cycles
- 2024: D+11.4 2020: D+11.3 2016: D+6.1 2012: D+14.6 2008: D+18.9
Not yet ingested
- Civics
- —
Market trends
- HPI YoY
- ▲ 26.11%
- Current HPI
- 1014.65
- Rent YoY
- —
- Metro
- Astoria, OR
- State GDP YoY
- ▲ 2.05%
- F500 in state
- 2
Industry mix (Fortune 500 HQ in OR)
| Industry | F500 HQs | Revenue |
|---|---|---|
| Consumer Goods | 1 | $51B |
|
||
Price history
+196.8% since first listed10 events — show timeline
- 2026-05-06 Pending — RMLS
- 2026-04-10 Listed $650,000 RMLS
- 2018-06-21 Sold (Public Records) $359,900 Public Records
- 2018-06-21 Sold (MLS) $359,900 CAR
- 2018-01-30 Listed $359,900 CAR
- 2016-12-02 Sold (Public Records) $119,065 Public Records
- 2016-12-02 Sold (MLS) $233,000 RMLS
- 2016-12-02 Sold (MLS) $233,000 CAR
- 2016-05-22 Listed $219,000 CAR
- 2016-05-16 Listed $219,000 RMLS
Property tax history
+3.5%/yrLatest (2025): $4,741 · -0.1% YoY. Source: county tax records.
Cash-flow waterfall
monthlySold comps — $/sqft
last 12 mo · ≤1 miLoading sold comps…