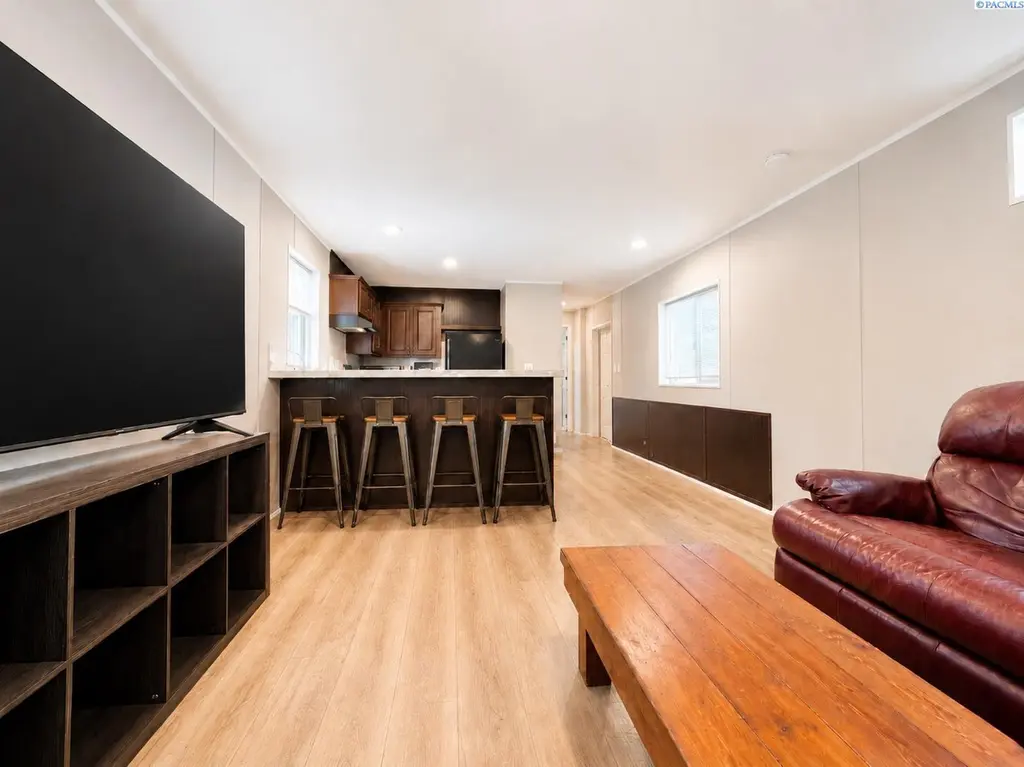
1155 SE Professional Mall Blvd #306 Blvd
Pullman, WA 99163
$85,000F
2 bd · 2.0 ba ·
924 sqft ·
Built 2020
· Manufactured
· Active
· 24 DOM
Cashflow @ list (25.0% down · 7.5%)
Estimated rent
$859/mo
Mortgage (P&I)
−$446
Tax + insurance
−$111
HOA
−$465
Vac / Maint / Mgmt
−$180
Net cashflow
$-343/mo
Annual
$-4,115/yr
Cap rate
1.45%
Cash-on-cash
-17.29%
DSCR
0.23
1% rule
1.01%
Cash to close
$23,800
Investor read
- This is a 2-bed/2.0-bath manufactured listed at $85k.
- At list price, monthly cash flow is $-343 ($-4k/yr) — negative.
- To cash-flow at today's rent, offer at most $24k (71.3% below list).
- Meets the 1% rule at list price ($859 rent vs $85k).
- It's been on market 24 days — a 2% lower offer ($84k) is reasonable based on typical stale-listing flexibility.
- Recommended offer: $24k (71.3% below list) — sets the bar for cash-flow.
- Local home prices are declining (-3.0%/yr); year-one equity from $588 of loan paydown is wiped out by about $3k of value loss. Plan a longer hold.
- Location reads 85/100 on livability (#32 in WA, #542 nationally) — a professional / high-income tenant draw. Strengths: crime A+, amenities A+, commute A+; Watch: housing C-, employment F.
- Pullman School District (town): math 63% / reading 76% proficiency, ranked #30 of 291 in WA (top 10%) — acceptable for families but not a draw, mixed tenant base, ~2y average lease.
- Zoned schools: Jefferson Elementary (315 students, 63% FRL); Lincoln Middle School (593 students, 38% FRL); Pullman High School (896 students, 31% FRL) — zoned schools average 44% FRL vs 24% district-wide (19 pts higher); higher-poverty schools than district average — tighter screening recommended.
- Watch-outs: HOA is 54% of rent.
- Market conditions: Rents rising (+3.4%/yr); 195 active listings in the ZIP; 13 comparable units currently listed for rent nearby; rentals lingering (median 46d on market — plan ~5-8 weeks vacancy on turnover, expect pricing pressure); 100% of comp listings sitting > 30 days — soft ceiling on asking rent; 49 units permitted in Whitman County in 2024 (0 in 5+ unit buildings).
- Whitman County population projected at +57% by 2050 — long-run rental-demand tailwind backs the buy-and-hold thesis.
- 2 sale attempts since 6y ago; this cycle's ask has dropped $15k (15%) from the opening price — seller is motivated, your offer sets the floor, not the list.
- Cap rate 1.5% vs local median 2.2% in Pullman — below-typical yield; the buyer is paying a premium for something (appreciation thesis, condition, location) that the cap rate doesn't capture.
Questions for listing agent
- What do current leases actually rent for vs. the listed asking? Can we see a recent rent roll and the last 12 months of T-12 income?
- What does the HOA fee cover, when was the last increase, and are there any pending special assessments or reserve-fund shortfalls?
- Is there a deadline driving the sale (1031 exchange, divorce, estate, relocation)? That informs how much negotiation room exists.
- Schools are A-rated — typically a magnet for longer-tenancy family renters. What's the average tenant stay here, and is there a school-zone premium baked into asking?
- The area grade is low — what's the realistic commute time and amenity access for the typical tenant pool here? Any planned neighborhood developments (good or bad) we should know about?
- What's the average days-on-market for RENTAL listings here right now (not sales)? A rising rental-DOM trend means longer vacancies and softer asking-rent achievability than the comps imply.
- What's the recent tenant-quality profile in this submarket — average credit score on applications, eviction rate, late-payment / NSF rate, and stable-employment percentage? A property-management company in the area should have these aggregated.
- How much new for-sale + rental construction is in the pipeline within 1–3 miles? Heavy new supply typically softens prices + rents 12–24 months out; constrained supply supports both.
CashFlowRE · CFR-NGCQGQFH9QWNR3
· Data 9 h ago
cashflowre.app · 2026-05-29