1155 SE Professional Mall Blvd #306 Blvd · Pullman, WA
Flood risk No data
- FEMA flood zone
- —
- Chance of flooding over 30 yrs
- —
- Est. flood insurance / yr
- —
Fire risk No data
- Est. fire insurance / yr
- —
Heat risk No data
- Hot days now (above threshold)
- —
- Hot days in 30 yrs
- —
Wind risk No data
- Chance of severe wind over 30 yrs
- —
Air-quality risk No data
- Unhealthy air days now
- —
- Unhealthy air days in 30 yrs
- —
Risk factors via First Street. Map © Google.
Why this score? — see what drove the D- grade
The composite is a weighted blend of 9 inputs, each scored 0–100. Each bar is that input's sub-score; the figure is the points it added to the 100-point composite (weight × sub-score).
- 1% rule +8.1/10.0
- ARV discount +7.5/15.0
- Cash flow +6.6/30.0
- Schools +5.8/10.0
- Livability +4.2/5.0
- Rent growth +3.4/5.0
- Condition / age +2.5/5.0
- DSCR +0.9/10.0
- Appreciation +0.0/10.0
$85,000
🖨 Deal sheet (PDF) 📄 Offer letter ✓ Due diligence
Listing remarks MLS
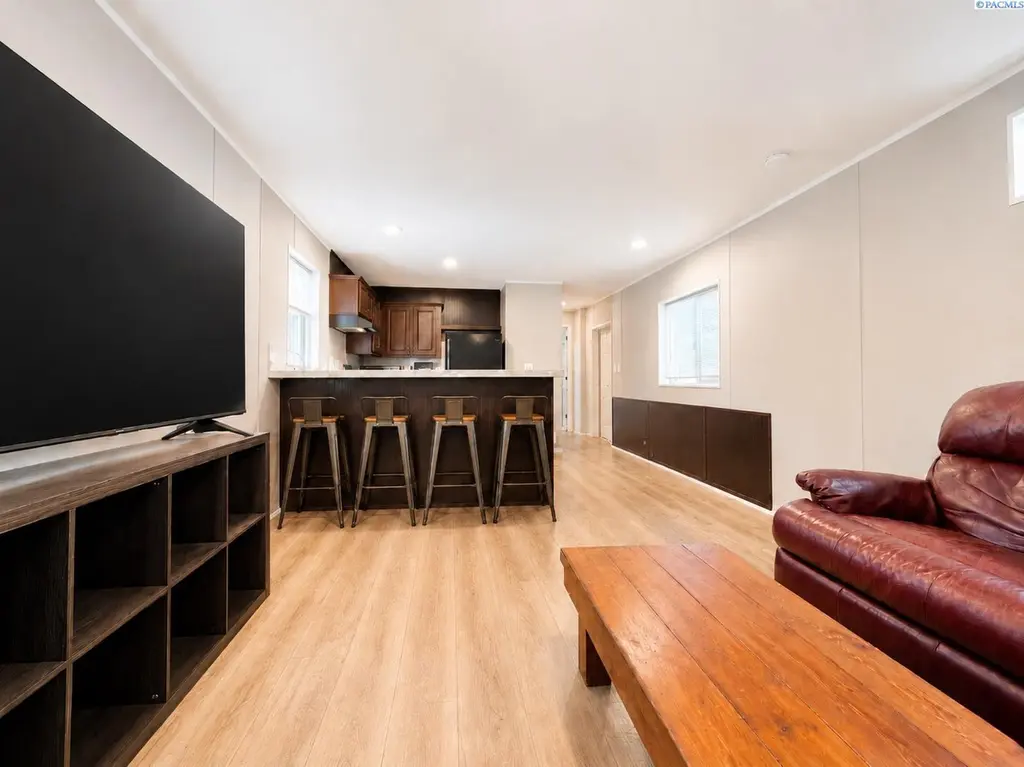
Looking for spacious affordable housing to own instead of paying rent, in great location? Here's your next home! Brand new 2020 Fleetwood manufactured home just moved in to park, features 2 Bedrooms and 2 full Baths generously spaced over 880 sq feet. Large master bedroom with walk in closet and full bath. Big kitchen with "open room" concept and second bed with bathroom. Central heat and air conditioning. Large lot set up great for you and your pets. Campus Vista Park is conveniently located close to WSU campus, schools, parks, play fields, retail business and adjacent to Public transportation routes. Park is pet friendly with NO breed restrictions.
Key facts
- Move-in ready
- Central ac
- Fenced yard
Tags
Property features AI
Finance
- Other: Property is a manufactured home on a rented lot
- HOA & community: Homeowners association with a fee of $465
Exterior
- Parking: No garage; Off-street parking
- Utilities: Public water; Electricity connected; Sewer connected; Electric on property
- Home design: Manufactured home (single wide); One story
- Construction: Composition roof; Built as new construction; Manufactured by Broadmore; Located in Campus Vista park
- Exterior features: Deck; Private road frontage; Located in a residentially zoned area; Located in a leased-land community (land is leased)
Interior
- Kitchen: Dishwasher; Microwave; Range / Oven; Refrigerator
- Flooring: Carpet; Laminate
- Bathrooms: 2 full bathrooms
- Heating & cooling: Electric forced air heating; Central air conditioning
- Interior features: Breakfast bar
- Laundry & utility: Washer; Dryer
Neighborhood map
What this means for you Summary
Snapshot
- This is a 2-bed/2.0-bath manufactured listed at $85k.
Deal economics
- At list price, monthly cash flow is $-140 ($-2k/yr) — negative.
- To cash-flow at today's rent, offer at most $60k (29.1% below list).
- Meets the 1% rule at list price ($1k rent vs $85k).
- Recommended offer: $60k (29.1% below list) — sets the bar for cash-flow.
- Cap rate 4.3% vs local median 2.2% in Pullman — top-decile yield for the area; either an underpriced asset or a hidden risk that comps aren't pricing in. Stress-test before assuming the spread holds.
Location & tenants
- Location reads 85/100 on livability (#32 in WA, #542 nationally) — a professional / high-income tenant draw. Strengths: crime A+, amenities A+, commute A+; Watch: housing C-, employment F.
- Pullman School District (town): math 63% / reading 76% proficiency, ranked #30 of 291 in WA (top 10%) — acceptable for families but not a draw, mixed tenant base, ~2y average lease.
- Zoned schools: Jefferson Elementary (315 students, 63% FRL); Lincoln Middle School (593 students, 38% FRL); Pullman High School (896 students, 31% FRL) — zoned schools average 44% FRL vs 24% district-wide (19 pts higher); higher-poverty schools than district average — tighter screening recommended.
- Market conditions: Rents rising (+3.4%/yr); 195 active listings in the ZIP; 13 comparable units currently listed for rent nearby; rentals lingering (median 46d on market — plan ~5-8 weeks vacancy on turnover, expect pricing pressure); 100% of comp listings sitting > 30 days — soft ceiling on asking rent; 49 units permitted in Whitman County in 2024 (0 in 5+ unit buildings).
Forward outlook
- Local home prices are declining (-3.0%/yr); year-one equity from $588 of loan paydown is wiped out by about $3k of value loss. Plan a longer hold.
- Whitman County population projected at +57% by 2050 — long-run rental-demand tailwind backs the buy-and-hold thesis.
Negotiation context
- It's been on market 24 days — a 2% lower offer ($84k) is reasonable based on typical stale-listing flexibility.
- 2 sale attempts since 6y ago; this cycle's ask has dropped $15k (15%) from the opening price — seller is motivated, your offer sets the floor, not the list.
Risks & watch-outs
- Watch-outs: HOA is 42% of rent.
Questions for the listing agent
- What do current leases actually rent for vs. the listed asking? Can we see a recent rent roll and the last 12 months of T-12 income?
- What does the HOA fee cover, when was the last increase, and are there any pending special assessments or reserve-fund shortfalls?
- Is there a deadline driving the sale (1031 exchange, divorce, estate, relocation)? That informs how much negotiation room exists.
- Schools are A-rated — typically a magnet for longer-tenancy family renters. What's the average tenant stay here, and is there a school-zone premium baked into asking?
- The area grade is low — what's the realistic commute time and amenity access for the typical tenant pool here? Any planned neighborhood developments (good or bad) we should know about?
- What's the average days-on-market for RENTAL listings here right now (not sales)? A rising rental-DOM trend means longer vacancies and softer asking-rent achievability than the comps imply.
- What's the recent tenant-quality profile in this submarket — average credit score on applications, eviction rate, late-payment / NSF rate, and stable-employment percentage? A property-management company in the area should have these aggregated.
- How much new for-sale + rental construction is in the pipeline within 1–3 miles? Heavy new supply typically softens prices + rents 12–24 months out; constrained supply supports both.
Investment metrics
- 1% rule
- 1.31% ✓
- Cap rate
- 4.31%
- Cash-on-cash
- -7.06%
- DSCR
- 0.69
- GRM
- 6.3
CMA / ARV
- ARV (on-the-fly)
- $55,440
- Comps found
- 5
Show comp detail 5 sales within ~0.75 mi
| Address | Dist | Beds/Ba | Sqft | Sold | Price | $/sf | Match |
|---|---|---|---|---|---|---|---|
| 1155 SE Pro Mall #409 | 0.02mi | 2/2.0 | 924 (0%) | 23mo | $60,000 | $65 | 80 |
| 1155 SE Professional Mall Blvd #421 Blvd #421 | 0.02mi | 2/1.0 | 840 (-9%) | 4mo | $39,000 | $46 | 77 |
| 1155 SE Pro Mall Blvd #319 #319 | 0.14mi | 3/2.0 (+1) | 980 (+6%) | 8mo | $35,000 | $36 | 72 |
| 1155 SE Professional Mall #209 | 0.14mi | 2/1.5 | 980 (+6%) | 12mo | $65,000 | $66 | 71 |
| 1155 SE Pro Mall Blvd #222 #222 | 0.14mi | 2/1.0 | 840 (-9%) | 7mo | $50,000 | $60 | 68 |
Match score weights: distance 35% · size 25% · config 20% · recency 20%. Top-matched comps best support the ARV.
Projected returns pro-forma
-3.0% appreciation · 3.43% rent growth · sell at horizon
- IRR
- -27.1%
- Equity multiple
- 0.08×
- Total profit
- $-21,928
- Equity at exit
- $12,674
- IRR
- -21.0%
- Equity multiple
- -0.15×
- Total profit
- $-27,425
- Equity at exit
- $7,349
Cash invested: $23,800 (down + closing). Projections, not guarantees.
Landlord ↔ Tenant lean methodology
- Overall (STATE)
- 28 Tenant-Leaning
- State Washington
- 28 Tenant-Leaning · D+8
- County
- — inherits STATE
- City
- — inherits STATE
ZIP-level market 99163
- Rents YoY
- 3.4%
- Active inventory
- 195
- Price-to-rent
- 6.3×
Monthly cashflow live
- Estimated rent
- $1,116 high interval (Pro) →
- Mortgage (P&I)
- −$446
- Tax from tax record
- −$76 /mo · $907/yr
- Insurance
- −$35
- HOA
- −$465
- Vacancy / Maint / Mgmt
- −$234
- Net cashflow
- $-140
Break-even live
Sensitivity live
| Price | -10% $-92 | -5% $-116 | +0% $-140 | +5% $-164 | +10% $-188 |
|---|---|---|---|---|---|
| Rent | -10% $-228 | -5% $-184 | +0% $-140 | +5% $-96 | +10% $-52 |
| Rate | -1.0pp $-97 | -0.5pp $-118 | base $-140 | +0.5pp $-162 | +1.0pp $-185 |
UW: 25.0% down · 7.5% · 30yr · 1.5% tax · 5.0% vac · 8.0% maint · 8.0% mgmt
Financing live
Cash to close
- Down payment
- $21,250
- Closing costs
- $2,550
- Reserves months
- —
- Total cash needed
- —
Loan-product check · same deal, 3 products live
Conventional
25% down · 7.5% · 30yr
- Down + closing
- —
- Monthly P&I
- —
- Monthly cashflow
- —
- DSCR
- —
- Eligible?
- —
Personal DTI + credit; lowest rate.
DSCR
20% down · 8.5% · 30yr
- Down + closing
- —
- Monthly P&I
- —
- Monthly cashflow
- —
- DSCR
- —
- Eligible?
- —
No personal income docs; deal must DSCR.
Hard money
10% down · 12.0% · 12mo
- Down + closing
- —
- Monthly P&I
- —
- Monthly cashflow
- —
- DSCR
- —
- Eligible?
- —
Short-term bridge; refi at stabilization.
Rent comps 13 comps
| Address | Beds | Baths | Sqft | Rent | $/sqft | DOM | Units | Dist |
|---|---|---|---|---|---|---|---|---|
| 1016 SE Latah St Pullman, WA | 2.0 | 1.0 | 735 | $1,050 | $1.43 | 45d | 4 | 0.36mi |
| 455 E Main St Pullman, WA | 2.0–5.0 | 2.0–5.0 | 975 | $539 | $0.55 | 45d | 1 | 0.86mi |
| 820 NE Colorado St Pullman, WA | 1.0–8.0 | 1.0–3.0 | 723 | $478 | $0.66 | 45d | 62 | 0.95mi |
| 305 NE Spaulding St Pullman, WA | 1.0 | 1.0 | 625 | $1,000 | $1.60 | 45d | 2 | 1.01mi |
| 605 S Grand Ave Apt M Pullman, WA | 2.0 | 2.0 | 1000 | $1,350 | $1.35 | 45d | 1 | 1.02mi |
| 605 S Grand Ave Apt B Pullman, WA | 1.0 | 1.0 | 790 | $1,000 | $1.27 | 45d | 1 | 1.02mi |
| 620 NE Kamiaken St Pullman, WA | 2.0–3.0 | 1.0–2.0 | 895 | $885 | $0.99 | 45d | 12 | 1.09mi |
| 1125 NE Valley Rd Pullman, WA | 3.0 | 1.0–2.0 | 1015 | $479 | $0.47 | 45d | 11 | 1.28mi |
| 1300 NE Williams St Unit 4 Pullman, WA | 1.0 | 1.0 | 550 | $850 | $1.55 | 45d | 1 | 1.31mi |
| 910 NE Providence Ct Pullman, WA | 1.0–2.0 | 1.0 | 680 | $1,250 | $1.84 | 45d | 10 | 1.36mi |
| 880 NE Providence Ct Pullman, WA | 1.0–3.0 | 1.0–2.0 | 852 | $1,250 | $1.47 | 45d | 11 | 1.44mi |
| 1365 NE Brandi Way Pullman, WA | 1.0–3.0 | 1.0–2.5 | 941 | $1,270 | $1.35 | 45d | 16 | 1.45mi |
| 1225-1235 NW Hall Dr Pullman, WA | 2.0 | 1.0 | 525 | $950 | $1.81 | 45d | 1 | 1.47mi |
HOA detail
- Monthly dues
- $465 · $5,580/yr
Listing history 17 events
-
2026-06-22days on market $85,000 Active 24 DOM
-
2026-06-19days on market $85,000 Active 21 DOM
-
2026-06-18days on market $85,000 Active 20 DOM
-
2026-06-17days on market $85,000 Active 19 DOM
-
2026-06-16days on market $85,000 Active 18 DOM
-
2026-06-15days on market $85,000 Active 17 DOM
-
2026-06-14days on market $85,000 Active 15 DOM
-
2026-06-12days on market $85,000 Active 14 DOM
-
2026-06-09days on market $85,000 Active 11 DOM
-
2026-06-08days on market $85,000 Active 10 DOM
-
2026-06-07days on market $85,000 Active 9 DOM
-
2026-06-05pricedays on market $85,000 Active 6 DOM
-
2026-06-02days on market $99,999 Active 4 DOM
-
2026-06-01days on market $99,999 Active 3 DOM
-
2026-05-31days on market $99,999 Active 2 DOM
-
2026-05-30remarks 699-char remark
-
2026-05-30$99,999 Active 1 DOM
ⓘ Source: listings_history table (triggers on properties + properties_extension) + one-shot
backfill from property_details.listing_events for pre-trigger history.
Tax reassessment forecast WA · Resets to sale price
- Current annual tax
- $907 · $76/mo
- Projected year-2 tax
- $907 · $76/mo
- Expected delta
- $0/yr ($0/mo · -0.0%)
ⓘ Screening estimate from a state-policy table — verify with the county assessor before closing.
Nearby sold comps map
Loading sold comps map…
Walkable amenities ~0.75 mi
Loading nearby amenities…
Taxation est. · year 1
- Rental income
- $13,392
- − Mortgage interest
- −$4,761
- − Property taxes
- −$907
- − Insurance
- −$425
- − Repairs & maintenance
- −$1,071
- − Management
- −$1,071
- − HOA
- −$5,580
- − Depreciation
- −$2,473
- Taxable loss
- −$2,897
- Est. tax savings @ 24.0%
- +$695
- After-tax cash flow
- $-986/yr
For passive investors: Depreciation is non-cash, so a rental often shows a tax loss while cash-flowing — sheltering income. Rental losses are passive: they offset passive income freely, and up to $25,000/yr can offset ordinary (W-2) income if you actively participate and your MAGI is under $100k (phasing out to $0 by $150k); unused losses carry forward. On sale, claimed depreciation is recaptured at up to 25%, and gains may owe capital-gains tax (a 1031 exchange can defer both). Figures are a year-1 estimate at your 24.0% rate — not tax advice; consult a CPA.
Schools (NCES district)
- District
- Pullman School District
- NCES district ID
- 5306930
- Math proficiency
- 63% ▼ -1.00%
- Reading proficiency
- 76% ▲ 1.00%
- Median HH income
- $29,034
- Composite
- 58.15/100
- National rank
- #2131
- State rank
- #30 of 291 in WA
Livability — Pullman
- Score
- 85/100
- State rank
- #32
- US rank
- #542
Category grades
Schools grade is shown separately in the Schools card above.
Census & demographics
- Census place
- Pullman, WA
- County
- Whitman County · 34,022 people
- City population
- 34,022
- Metro
- Pullman, WA
- Population (ZIP)
- 34,022
- Household income
- $48,231
- Rent vs Own
- Severe rent burden
- 3453.0
Population outlook (Whitman County) Hauer SSP2
- Today (2025)
- 57,639 people
- By 2030
- 63,440 · +10.1%
- By 2040
- 75,870 · +31.6%
- By 2050
- 90,294 · +56.7%
- By 2075
- 131,756 · +128.6%
- By 2100
- 169,239 · +193.6%
Race, ethnicity, and origin ACS 2023
- Neighborhood character
- Predominantly White (69%)
- Race & ethnicity
- White 69% Two or more races 12% Asian 10% Hispanic / Latino 9% Black 2%
- Hispanic origin (detail)
- Mexican 6%
- Common ancestry
- Italian 5% Portuguese 5% Slovak 3%
- Foreign-born
- 10% · China, Canada, Vietnam
- Languages at home
- 86% English-only · Spanish 4% Chinese 4% Other Indo-European 2%
Political lean MEDSL · Whitman
- 2024 margin
- Lean D (+9.0) · D 52.8% · R 43.8% · Other 3.4%
- 2008→2024 swing
- +3.5pp toward D · 2008: 5.5pp · 2024: 9.0pp
- All cycles
- 2024: D+9.0 2020: D+10.0 2016: D+0.5 2012: R+3.7 2008: D+5.5
Not yet ingested
- Civics
- —
Market trends
- HPI YoY
- ▼ -367.44%
- Current HPI
- 153.4778
- Rent YoY
- ▲ 3.43%
- Metro
- Pullman, WA
- State GDP YoY
- ▲ 4.65%
- F500 in state
- 22
Industry mix (Fortune 500 HQ in WA)
| Industry | F500 HQs | Revenue |
|---|---|---|
| Retail | 2 | $269B |
|
||
| Technology / Retail | 1 | $638B |
|
||
| Technology | 1 | $245B |
|
||
| Telecommunications | 1 | $38B |
|
||
| Food / Beverage | 1 | $36B |
|
||
| Automotive / Trucks | 1 | $34B |
|
||
Price history
+25.2% since first listed3 events — show timeline
- 2026-05-29 Listed $99,999 PACMLS
- 2020-05-28 Sold (MLS) $79,900 PACMLS
- 2020-02-17 Listed $79,900 PACMLS
Property tax history
+26.9%/yrLatest (2026): $907 · -5.2% YoY. Source: county tax records.
Cash-flow waterfall
monthlySold comps — $/sqft
last 12 mo · ≤1 miLoading sold comps…