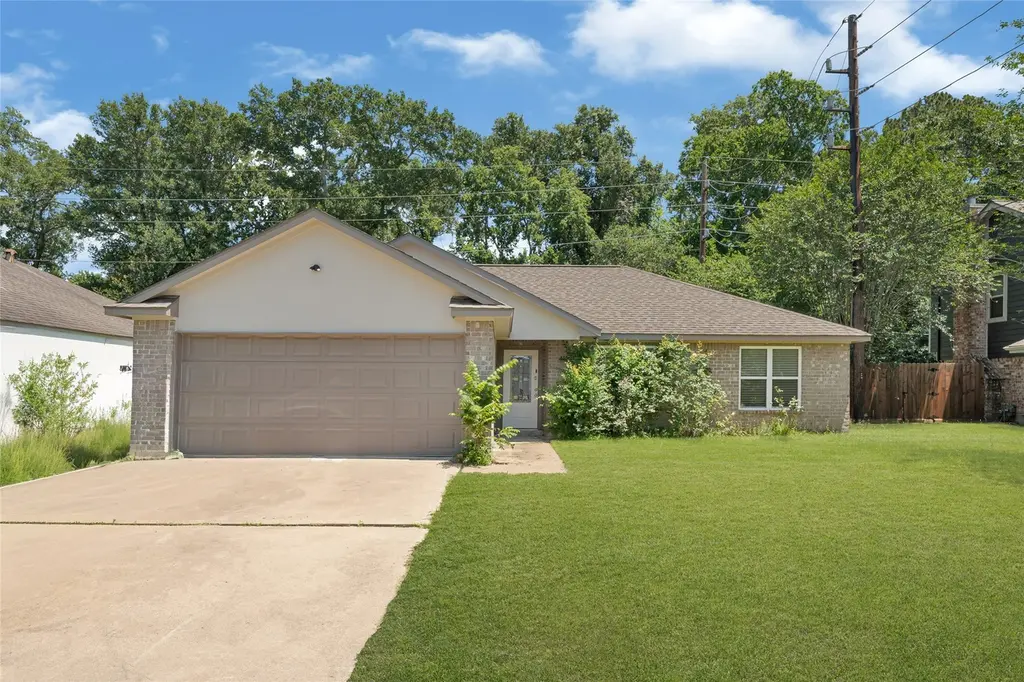
4814 Pine Cliff Dr
Houston, TX 77084
$240,000D+
4 bd · 2.0 ba ·
1,751 sqft ·
Built 1980
· SingleFamily
· Active
· 26 DOM
Cashflow @ list (25.0% down · 7.5%)
Estimated rent
$2,105/mo
Mortgage (P&I)
−$1,259
Tax + insurance
−$468
HOA
−$40
Vac / Maint / Mgmt
−$442
Net cashflow
$-104/mo
Annual
$-1,244/yr
Cap rate
5.77%
Cash-on-cash
-1.85%
DSCR
0.92
1% rule
0.88%
Cash to close
$67,200
Investor read
- This is a 4-bed/2.0-bath single-family listed at $240k.
- At list price, monthly cash flow is $-104 ($-1k/yr) — negative.
- To cash-flow at today's rent, offer at most $222k (7.6% below list).
- To meet the 1% rule (rent ≥ 1% of price), the offer needs to be $210k (12.3% below list).
- It's been on market 26 days — a 2% lower offer ($236k) is reasonable based on typical stale-listing flexibility.
- Recommended offer: $210k (12.3% below list) — sets the bar for 1% rule.
- Local home prices are declining (-1.4%/yr); year-one equity from $2k of loan paydown is wiped out by about $3k of value loss. Plan a longer hold.
- Location reads 74/100 on livability (#184 in TX, #4,771 nationally) — a middle-class / working-renter tenant base. Strengths: amenities A+, cost of living A+, housing A+; Watch: crime F.
- Katy ISD (suburban): math 61% / reading 63% proficiency, ranked #29 of 826 in TX (top 4%) — acceptable for families but not a draw, mixed tenant base, ~2y average lease.
- Zoned schools: Bear Creek El (math 23% / reading 31%, grade F, #2,791 of 4,322 statewide, top 68%, 668 students, 84% FRL); Cardiff J H (math 34% / reading 40%, grade F, #756 of 1,662 statewide, top 47%, 863 students, 84% FRL); Katy H S (math 62% / reading 74%, grade B, #150 of 1,632 statewide, top 10%, 3,330 students, 38% FRL) — zoned schools average 69% FRL vs 27% district-wide (41 pts higher); higher-poverty schools than district average — tighter screening recommended.
- Zoned-school proficiency averages 44% at this address vs 62% district-wide (-18 pts) — the specific schools serving this property underperform the Katy ISD average; the district grade overstates school quality for this exact location.
- Market conditions: Rents soft (-2.9%/yr); 505 active listings in the ZIP; 12 comparable units currently listed for rent nearby; rentals at typical pace (median 24d on market — plan ~3-4 weeks tenant-placement turnaround); solid renter incomes; 29,883 units permitted in Harris County in 2024 (8,621 in 5+ unit buildings).
- Harris County population projected at +47% by 2050 — long-run rental-demand tailwind backs the buy-and-hold thesis.
- Climate carrying-cost: severe wind risk, 99% chance of damaging wind over 30y; extreme-heat days projected 6→18/yr by 2055 (HVAC capex compounding) — expect insurance premiums to compound above CPI over the hold.
- Cap rate 5.8% vs local median 3.2% in Houston — top-decile yield for the area; either an underpriced asset or a hidden risk that comps aren't pricing in. Stress-test before assuming the spread holds.
- This rent runs 31% of the median local income ($81k/yr) — at the standard rent-burdened threshold; future hikes will face affordability resistance.
Questions for listing agent
- What do current leases actually rent for vs. the listed asking? Can we see a recent rent roll and the last 12 months of T-12 income?
- What does the HOA fee cover, when was the last increase, and are there any pending special assessments or reserve-fund shortfalls?
- Is there a deadline driving the sale (1031 exchange, divorce, estate, relocation)? That informs how much negotiation room exists.
- Schools are D-rated, which usually means shorter tenancies and higher turnover. Who's the typical renter profile here, and what's been the actual vacancy rate?
- Crime grade is F in this area — have there been break-ins, vandalism, or insurance claims at this property in the last 3 years? What carrier currently insures it and at what premium?
- The area grade is low — what's the realistic commute time and amenity access for the typical tenant pool here? Any planned neighborhood developments (good or bad) we should know about?
- What's the average days-on-market for RENTAL listings here right now (not sales)? A rising rental-DOM trend means longer vacancies and softer asking-rent achievability than the comps imply.
- What's the recent tenant-quality profile in this submarket — average credit score on applications, eviction rate, late-payment / NSF rate, and stable-employment percentage? A property-management company in the area should have these aggregated.
CashFlowRE · CFR-NHDMGECYT266P1
· Data 1 day ago
cashflowre.app · 2026-05-29