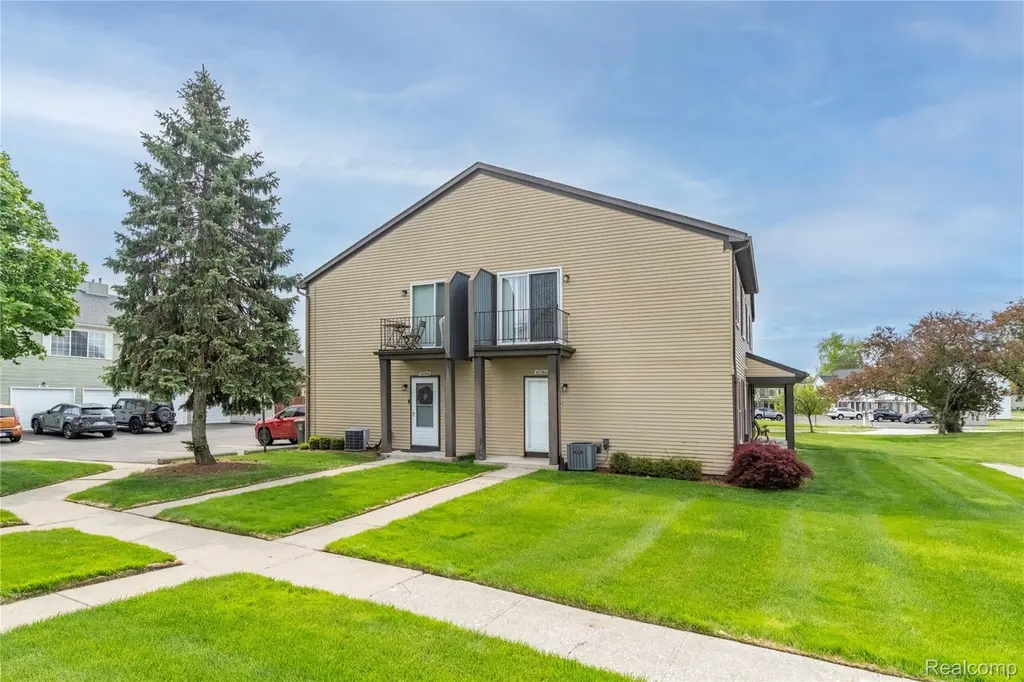
42564 Saratoga Rd #31
Canton, MI 48187
$169,900D-
2 bd · 1.0 ba ·
1,107 sqft ·
Built 1983
· Condo
· Active
· 26 DOM
Cashflow @ list (25.0% down · 7.5%)
Estimated rent
$1,678/mo
Mortgage (P&I)
−$891
Tax + insurance
−$283
HOA
−$343
Vac / Maint / Mgmt
−$352
Net cashflow
$-192/mo
Annual
$-2,301/yr
Cap rate
4.94%
Cash-on-cash
-4.84%
DSCR
0.78
1% rule
0.99%
Cash to close
$47,572
Investor read
- This is a 2-bed/1.0-bath condo listed at $170k.
- At list price, monthly cash flow is $-192 ($-2k/yr) — negative.
- To cash-flow at today's rent, offer at most $142k (16.3% below list).
- To meet the 1% rule (rent ≥ 1% of price), the offer needs to be $168k (1.3% below list).
- It's been on market 26 days — a 2% lower offer ($167k) is reasonable based on typical stale-listing flexibility.
- Recommended offer: $142k (16.3% below list) — sets the bar for cash-flow.
- Local home prices are declining (-3.0%/yr); year-one equity from $1k of loan paydown is wiped out by about $5k of value loss. Plan a longer hold.
- Location reads: area grade D — affects rentability + tenant quality, not the cash-flow math above.
- Plymouth-Canton Community Schools (suburban): math 58% / reading 66% proficiency, ranked #27 of 540 in MI (top 5%) — acceptable for families but not a draw, mixed tenant base, ~2y average lease; only 14% free/reduced lunch — higher-income household profile.
- Watch-outs: HOA is 20% of rent.
- Market conditions: Rents rising (+1.6%/yr); 180 active listings in the ZIP; 18 comparable units currently listed for rent nearby; rentals leasing fast (median 13d on market — plan ~1-2 weeks tenant-placement turnaround); high-income renter base; 2,639 units permitted in Wayne County in 2024 (1,216 in 5+ unit buildings).
- Wayne County population projected at -17% by 2050 — secular population decline; favor cash flow + early exit over multi-decade hold.
- 10 sale attempts since 23y ago with the ask held roughly flat each time — persistent listings suggest the price (not the market) is what's stuck; bring a comps-based counter.
- Current owner paid $1k; list at $170k implies a 13492% gain — meaningful room to come down on a strong offer.
- This rent is only 17% of the median local income ($120k/yr) — well below the 30% rent-burden line; pricing power to push rent on renewal without tenant pushback.
Questions for listing agent
- What do current leases actually rent for vs. the listed asking? Can we see a recent rent roll and the last 12 months of T-12 income?
- What does the HOA fee cover, when was the last increase, and are there any pending special assessments or reserve-fund shortfalls?
- Any open or pending special assessments — roof, HVAC, plumbing, elevator, façade? What's the per-unit balance and payoff schedule, and is the seller paying it off at close or rolling it to the buyer?
- Is there a deadline driving the sale (1031 exchange, divorce, estate, relocation)? That informs how much negotiation room exists.
- The area grade is low — what's the realistic commute time and amenity access for the typical tenant pool here? Any planned neighborhood developments (good or bad) we should know about?
- What's the average days-on-market for RENTAL listings here right now (not sales)? A rising rental-DOM trend means longer vacancies and softer asking-rent achievability than the comps imply.
- What's the recent tenant-quality profile in this submarket — average credit score on applications, eviction rate, late-payment / NSF rate, and stable-employment percentage? A property-management company in the area should have these aggregated.
- How much new apartment / multifamily construction is in the pipeline within 1–3 miles? Heavy new supply (>2% of stock underway) typically softens rents 12–24 months out; light construction supports rent growth.
CashFlowRE · CFR-NKPHWX9CDDN4EX
· Data 1 day ago
cashflowre.app · 2026-05-29