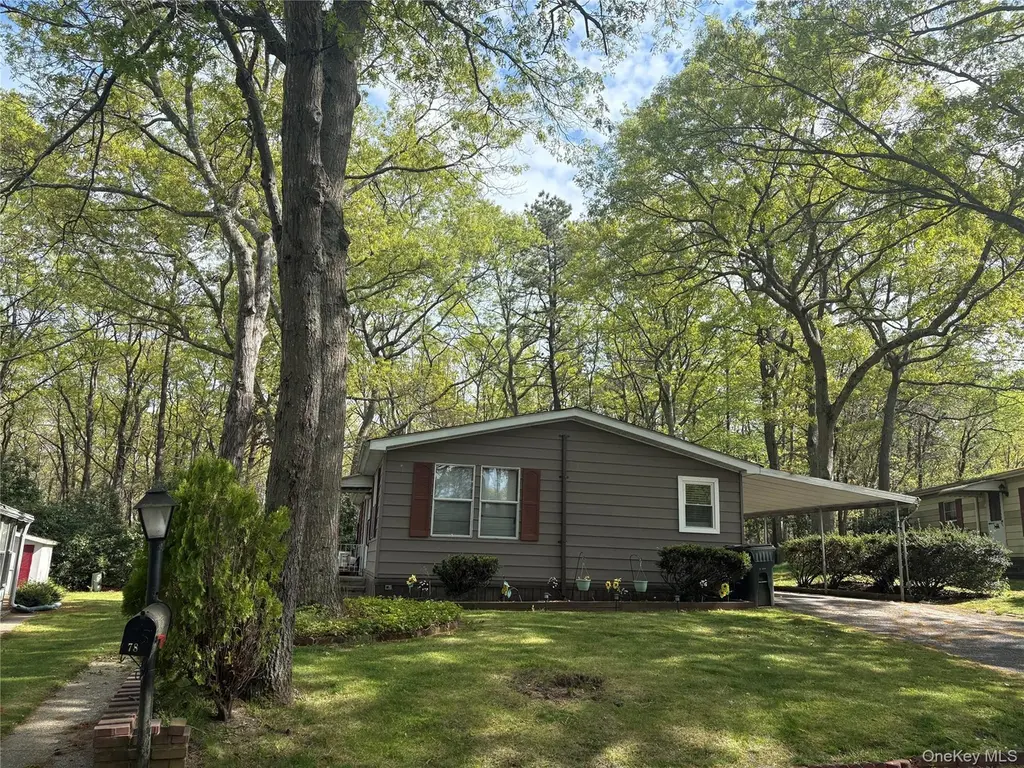
525/78 Riverleigh Ave
Riverside, NY 11901
$170,000C+
2 bd · 2.0 ba ·
1,152 sqft ·
Built 1980
· Manufactured
· Active
· 19 DOM
Cashflow @ list (25.0% down · 7.5%)
Estimated rent
$3,932/mo
Mortgage (P&I)
−$891
Tax + insurance
−$172
HOA
−$1,132
Vac / Maint / Mgmt
−$826
Net cashflow
$911/mo
Annual
$10,927/yr
Cap rate
12.72%
Cash-on-cash
22.96%
DSCR
2.02
1% rule
2.31%
Cash to close
$47,600
Investor read
- This is a 2-bed/2.0-bath manufactured listed at $170k.
- At list price, monthly cash flow is $911 ($11k/yr) — positive.
- The deal already cash-flows at list — no discount required.
- Meets the 1% rule at list price ($4k rent vs $170k).
- It's been on market 19 days — a 2% lower offer ($167k) is reasonable based on typical stale-listing flexibility.
- Recommended offer: $167k (1.5% below list) — sets the bar for market timing.
- Local home prices are declining (-3.0%/yr); year-one equity from $1k of loan paydown is wiped out by about $5k of value loss. Plan a longer hold.
- Location reads 54/100 on livability (#1,145 in NY) — a working-class tenant base; expect higher turnover. Strengths: crime A, health & safety B+; Watch: amenities F, commute F, employment D-.
- Riverhead Central School District (suburban): math 34% / reading 48% proficiency, ranked #489 of 590 in NY (top 83%) — families likely to look elsewhere, expect single-tenant / working-renter base with shorter leases.
- Zoned schools: Aquebogue Elementary School (math 47% / reading 57%, grade C-, #988 of 2,108 statewide, top 49%, 474 students, 40% FRL); Riverhead Middle School (math 18% / reading 35%, grade F, #594 of 729 statewide, top 81%, 827 students, 57% FRL); Riverhead Senior High School (math 80% / reading 86%, grade A, #440 of 1,100 statewide, top 40%, 2,001 students, 52% FRL).
- Zoned-school proficiency averages 54% at this address vs 41% district-wide (+13 pts) — the actual schools serving this property are materially stronger than the Riverhead Central School District average implies; a family-tenant draw the district grade alone would hide.
- Watch-outs: HOA is 29% of rent.
- Market conditions: 192 active listings in the ZIP; 6 comparable units currently listed for rent nearby; rentals at typical pace (median 26d on market — plan ~3-4 weeks tenant-placement turnaround); 1,366 units permitted in Suffolk County in 2024 (216 in 5+ unit buildings).
- Suffolk County population projected to shrink 5% by 2050 — rents likely to lag national; underwrite the cash flow, not the appreciation.
- At projected returns (-3.0% appreciation + 3.0% rent growth), your $48k cash investment doubles in ~6 years — after that, you're playing with house money.
- Climate carrying-cost: severe wind risk, 80% chance of damaging wind over 30y — expect insurance premiums to compound above CPI over the hold.
Questions for listing agent
- What does the HOA fee cover, when was the last increase, and are there any pending special assessments or reserve-fund shortfalls?
- Is there a deadline driving the sale (1031 exchange, divorce, estate, relocation)? That informs how much negotiation room exists.
- Schools are F-rated, which usually means shorter tenancies and higher turnover. Who's the typical renter profile here, and what's been the actual vacancy rate?
- What's the average days-on-market for RENTAL listings here right now (not sales)? A rising rental-DOM trend means longer vacancies and softer asking-rent achievability than the comps imply.
- What's the recent tenant-quality profile in this submarket — average credit score on applications, eviction rate, late-payment / NSF rate, and stable-employment percentage? A property-management company in the area should have these aggregated.
- How much new for-sale + rental construction is in the pipeline within 1–3 miles? Heavy new supply typically softens prices + rents 12–24 months out; constrained supply supports both.
CashFlowRE · CFR-NNCHY317NQG9A5
· Data 20 h ago
cashflowre.app · 2026-05-29