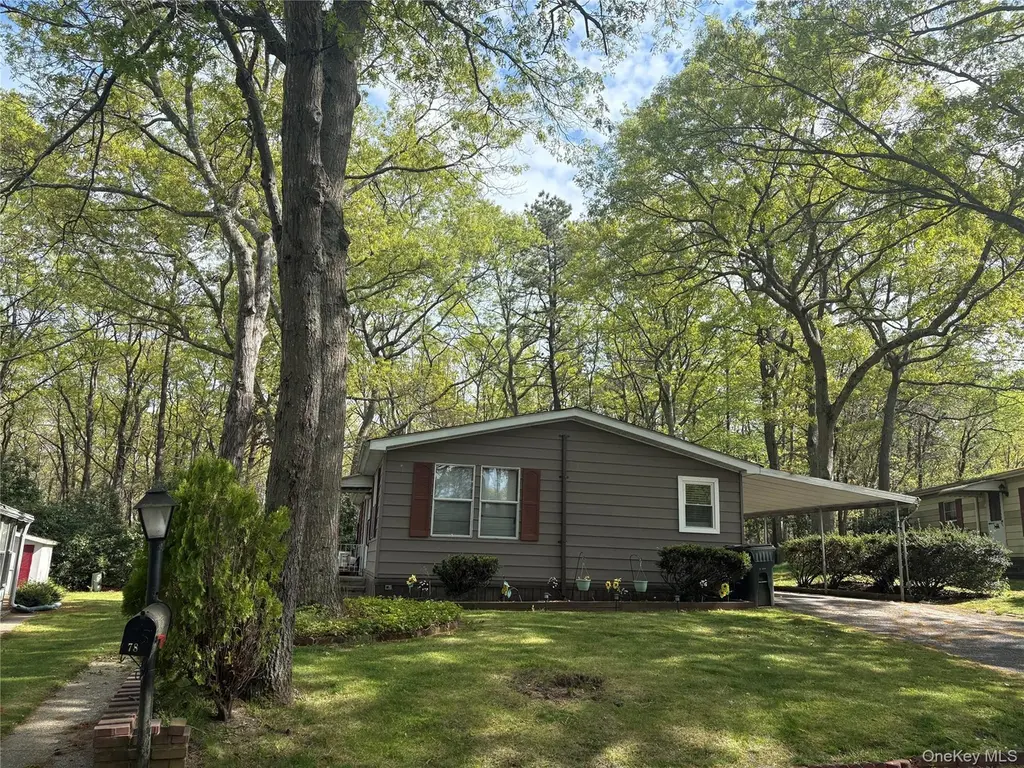
525/78 Riverleigh Ave · Riverside, NY
Flood risk 1/10 · Minimal
- FEMA flood zone
- X (unshaded)
- Chance of flooding over 30 yrs
- 0.0%
- Est. flood insurance / yr
- $507 – $1,088
Fire risk 4/10 · Minor
- Est. fire insurance / yr
- $691 – $1,283
Heat risk 4/10 · Minor
- Hot days now (above 92°F)
- 7 days/yr
- Hot days in 30 yrs
- 19 days/yr
Wind risk 8/10 · Major
- Chance of severe wind over 30 yrs
- 80.0%
Air-quality risk 3/10 · Minor
- Unhealthy air days now
- 2 days/yr
- Unhealthy air days in 30 yrs
- 3 days/yr
Risk factors via First Street. Map © Google.
Why this score? — see what drove the C+ grade
The composite is a weighted blend of 9 inputs, each scored 0–100. Each bar is that input's sub-score; the figure is the points it added to the 100-point composite (weight × sub-score).
- Cash flow +30.0/30.0
- 1% rule +10.0/10.0
- DSCR +10.0/10.0
- Schools +3.6/10.0
- Livability +2.7/5.0
- Rent growth +2.5/5.0
- Condition / age +2.5/5.0
- ARV discount +0.6/15.0
- Appreciation +0.0/10.0
$170,000
🖨 Deal sheet (PDF) 📄 Offer letter ✓ Due diligence
Listing remarks
Welcome to Riverwoods, a 55 and older community. Here is your chance to own a double-wide on the preserve. Upgrades include new roof, new kitchen, two new bathrooms, new duct work and hot water heater. Huge sunroom, carport, and shed. Primary bedroom has walk-in-closet , with custom built-in's. Land rent is approximately $1132. Includes trash and snow removal, water, and cesspool maintenance. Use of clubhouse. Southampton ocean access with permit. All buyers must be approved by Riverwoods.
Key facts
- Two new bathrooms
- New kitchen
- Shed
Tags
Property features AI
Finance
- Other: Senior community
- HOA & community: Part of Riverwoods association; Monthly association fee; Clubhouse and fitness center; Association covers common area maintenance, snow removal, trash and water
Exterior
- Parking: Carport with 2 spaces
- Utilities: PSEG electric; Cesspool sewer; Cable available; Electricity connected
- Home design: Mobile home; Living area reported as 1,152 (source: other)
- Construction: Vinyl siding construction
- Exterior features: Vinyl siding; Not waterfront
Interior
- Kitchen: Cooktop; Dishwasher; Electric cooktop; Electric oven; Microwave; Exhaust fan
- Bedrooms: Includes a bedroom on the first floor
- Bathrooms: 2 full bathrooms
- Heating & cooling: Propane heating; Ductless cooling
- Interior features: First-floor bedroom; First-floor full bathroom; Breakfast bar; Built-in features; Ceiling fans; Chef's kitchen; Pantry; Primary bathroom; Master bedroom on main level; Storage; Walk-in closets; Washer/dryer hookup; 9 total rooms; No basement; No attic
- Laundry & utility: Washer and dryer hookup; Electric water heater; Dryer included
Neighborhood map
What this means for you Summary
Snapshot
- This is a 2-bed/2.0-bath manufactured listed at $170k.
Deal economics
- At list price, monthly cash flow is $911 ($11k/yr) — positive.
- The deal already cash-flows at list — no discount required.
- Meets the 1% rule at list price ($4k rent vs $170k).
- Recommended offer: $167k (1.5% below list) — sets the bar for market timing.
Location & tenants
- Location reads 54/100 on livability (#1,145 in NY) — a working-class tenant base; expect higher turnover. Strengths: crime A, health & safety B+; Watch: amenities F, commute F, employment D-.
- Riverhead Central School District (suburban): math 34% / reading 48% proficiency, ranked #489 of 590 in NY (top 83%) — families likely to look elsewhere, expect single-tenant / working-renter base with shorter leases.
- Zoned schools: Aquebogue Elementary School (math 47% / reading 57%, grade C-, #988 of 2,108 statewide, top 49%, 474 students, 40% FRL); Riverhead Middle School (math 18% / reading 35%, grade F, #594 of 729 statewide, top 81%, 827 students, 57% FRL); Riverhead Senior High School (math 80% / reading 86%, grade A, #440 of 1,100 statewide, top 40%, 2,001 students, 52% FRL).
- Zoned-school proficiency averages 54% at this address vs 41% district-wide (+13 pts) — the actual schools serving this property are materially stronger than the Riverhead Central School District average implies; a family-tenant draw the district grade alone would hide.
- Market conditions: 192 active listings in the ZIP; 6 comparable units currently listed for rent nearby; rentals at typical pace (median 26d on market — plan ~3-4 weeks tenant-placement turnaround); 1,366 units permitted in Suffolk County in 2024 (216 in 5+ unit buildings).
Forward outlook
- Local home prices are declining (-3.0%/yr); year-one equity from $1k of loan paydown is wiped out by about $5k of value loss. Plan a longer hold.
- Suffolk County population projected to shrink 5% by 2050 — rents likely to lag national; underwrite the cash flow, not the appreciation.
- At projected returns (-3.0% appreciation + 3.0% rent growth), your $48k cash investment doubles in ~6 years — after that, you're playing with house money.
Negotiation context
- It's been on market 19 days — a 2% lower offer ($167k) is reasonable based on typical stale-listing flexibility.
Risks & watch-outs
- Watch-outs: HOA is 29% of rent.
- Climate carrying-cost: severe wind risk, 80% chance of damaging wind over 30y — expect insurance premiums to compound above CPI over the hold.
Questions for the listing agent
- What does the HOA fee cover, when was the last increase, and are there any pending special assessments or reserve-fund shortfalls?
- Is there a deadline driving the sale (1031 exchange, divorce, estate, relocation)? That informs how much negotiation room exists.
- Schools are F-rated, which usually means shorter tenancies and higher turnover. Who's the typical renter profile here, and what's been the actual vacancy rate?
- What's the average days-on-market for RENTAL listings here right now (not sales)? A rising rental-DOM trend means longer vacancies and softer asking-rent achievability than the comps imply.
- What's the recent tenant-quality profile in this submarket — average credit score on applications, eviction rate, late-payment / NSF rate, and stable-employment percentage? A property-management company in the area should have these aggregated.
- How much new for-sale + rental construction is in the pipeline within 1–3 miles? Heavy new supply typically softens prices + rents 12–24 months out; constrained supply supports both.
Investment metrics
- 1% rule
- 2.31% ✓
- Cap rate
- 12.72%
- Cash-on-cash
- 22.96%
- DSCR
- 2.02
- GRM
- 3.6
CMA / ARV
- ARV (on-the-fly)
- $147,456
- Comps found
- 8
Show comp detail 8 sales within ~0.75 mi
| Address | Dist | Beds/Ba | Sqft | Sold | Price | $/sf | Match |
|---|---|---|---|---|---|---|---|
| 525 Riverleigh Ave #67 | 0.07mi | 2/2.0 | 1,152 (0%) | 8mo | $175,000 | $152 | 90 |
| 525/159 Riverleigh Ave #159 | 0.18mi | 2/1.5 | 1,152 (0%) | 2mo | $135,000 | $117 | 88 |
| 525 Riverleigh Ave #45 | 0.14mi | 2/2.0 | 1,248 (+8%) | 2mo | $250,000 | $200 | 78 |
| 525/108A Riverleigh Ave Unit 108A | 0.11mi | 3/2.0 (+1) | 1,152 (0%) | 16mo | $151,000 | $131 | 77 |
| 525 Riverleigh Ave #167 | 0.13mi | 2/2.0 | 1,056 (-8%) | 13mo | $135,000 | $128 | 70 |
| 525/88 Riverleigh Ave #88 | 0.08mi | 2/2.0 | 1,248 (+8%) | 19mo | $99,000 | $79 | 67 |
| 525/179 Riverleigh | 0.17mi | 2/2.0 | 1,056 (-8%) | 22mo | $47,700 | $45 | 60 |
| 525-74 Riverleigh Ave #74 | 0.61mi | 2/2.0 | 1,200 (+4%) | 20mo | $120,000 | $100 | 48 |
Match score weights: distance 35% · size 25% · config 20% · recency 20%. Top-matched comps best support the ARV.
Projected returns pro-forma
-3.0% appreciation · 3.0% rent growth · sell at horizon
- IRR
- 16.2%
- Equity multiple
- 1.65×
- Total profit
- $31,134
- Equity at exit
- $25,348
- IRR
- 25.0%
- Equity multiple
- 3.20×
- Total profit
- $104,577
- Equity at exit
- $14,698
Cash invested: $47,600 (down + closing). Projections, not guarantees.
Landlord ↔ Tenant lean methodology
- Overall (STATE)
- 15 Strongly Tenant-Friendly
- State New York
- 15 Strongly Tenant-Friendly · D+10
- County
- — inherits STATE
- City
- — inherits STATE
ZIP-level market 11901
- Home prices YoY
- -29.5%
- Active inventory
- 192
- Price-to-rent
- 3.6×
Monthly cashflow live
- Estimated rent
- $3,932 high interval (Pro) →
- Mortgage (P&I)
- −$891
- Tax from tax record
- −$101 /mo · $1,217/yr
- Insurance
- −$71
- HOA
- −$1,132
- Vacancy / Maint / Mgmt
- −$826
- Net cashflow
- $911
Break-even live
Sensitivity live
| Price | -10% $1,007 | -5% $959 | +0% $911 | +5% $862 | +10% $814 |
|---|---|---|---|---|---|
| Rent | -10% $600 | -5% $755 | +0% $911 | +5% $1,066 | +10% $1,221 |
| Rate | -1.0pp $996 | -0.5pp $954 | base $911 | +0.5pp $867 | +1.0pp $822 |
UW: 25.0% down · 7.5% · 30yr · 1.5% tax · 5.0% vac · 8.0% maint · 8.0% mgmt
Financing live
Cash to close
- Down payment
- $42,500
- Closing costs
- $5,100
- Reserves months
- —
- Total cash needed
- —
Loan-product check · same deal, 3 products live
Conventional
25% down · 7.5% · 30yr
- Down + closing
- —
- Monthly P&I
- —
- Monthly cashflow
- —
- DSCR
- —
- Eligible?
- —
Personal DTI + credit; lowest rate.
DSCR
20% down · 8.5% · 30yr
- Down + closing
- —
- Monthly P&I
- —
- Monthly cashflow
- —
- DSCR
- —
- Eligible?
- —
No personal income docs; deal must DSCR.
Hard money
10% down · 12.0% · 12mo
- Down + closing
- —
- Monthly P&I
- —
- Monthly cashflow
- —
- DSCR
- —
- Eligible?
- —
Short-term bridge; refi at stabilization.
Rent comps 6 comps
| Address | Beds | Baths | Sqft | Rent | $/sqft | DOM | Units | Dist |
|---|---|---|---|---|---|---|---|---|
| 525 Riverleigh Ave Unit C8 Riverhead, NY | 1.0 | 1.0 | 1200 | $2,100 | $1.75 | 26d | 1 | 0.18mi |
| 331 E Main St Riverhead, NY | 1.0–2.0 | 1.0 | 822 | $4,300 | $5.23 | 0d | 3 | 0.92mi |
| 331 E Main St Unit 405 Riverhead, NY | 2.0 | 1.0 | 777 | $4,300 | $5.53 | 45d | 1 | 0.92mi |
| 331 E Main St Unit 204 Riverhead, NY | 2.0 | 1.0 | 867 | $3,350 | $3.86 | 45d | 1 | 0.92mi |
| 331 E Main St Unit 404 Riverhead, NY | 1.0 | 1.0 | 712 | $3,750 | $5.27 | 0d | 1 | 0.92mi |
| 5 Birch Ct Riverhead, NY | 3.0 | 1.0 | 940 | $4,000 | $4.26 | 21d | 1 | 1.27mi |
HOA detail
- Monthly dues
- $1,132 · $13,584/yr
- Likely covers
- watertrashsnow removalpool
Listing history 12 events
-
2026-06-21days on market $170,000 Active 19 DOM
-
2026-06-18days on market $170,000 Active 16 DOM
-
2026-06-17days on market $170,000 Active 15 DOM
-
2026-06-16days on market $170,000 Active 14 DOM
-
2026-06-15days on market $170,000 Active 13 DOM
-
2026-06-13days on market $170,000 Active 11 DOM
-
2026-06-09days on market $170,000 Active 7 DOM
-
2026-06-08days on market $170,000 Active 6 DOM
-
2026-06-07days on market $170,000 Active 5 DOM
-
2026-06-04days on market $170,000 Active 2 DOM
-
2026-06-02remarks 494-char remark
-
2026-06-02$170,000 Active 1 DOM
ⓘ Source: listings_history table (triggers on properties + properties_extension) + one-shot
backfill from property_details.listing_events for pre-trigger history.
Tax reassessment forecast NY · Partial reset (capped growth)
- Current annual tax
- $1,217 · $101/mo
- Projected year-2 tax
- $2,045 · $170/mo
- Expected delta
- +$828/yr (+$69/mo · 68.0%)
ⓘ Screening estimate from a state-policy table — verify with the county assessor before closing.
Climate risk First Street
- Flood 1/10 Low FEMA zone X (unshaded) · 0% chance over 30 yrs
- Wildfire 4/10 Moderate
- Heat 4/10 Moderate 7 d/yr ≥92°F today · 19 d/yr by 30 yrs out
- Wind 8/10 Severe 80% chance of damaging wind over 30 yrs
- Air quality 3/10 Moderate 2 unhealthy d/yr today · 3 by 30 yrs out
Nearby sold comps map
Loading sold comps map…
Walkable amenities ~0.75 mi
Loading nearby amenities…
Taxation est. · year 1
- Rental income
- $47,185
- − Mortgage interest
- −$9,523
- − Property taxes
- −$1,217
- − Insurance
- −$850
- − Repairs & maintenance
- −$3,775
- − Management
- −$3,775
- − HOA
- −$13,584
- − Depreciation
- −$4,945
- Taxable income
- $9,516
- Est. tax owed @ 24.0%
- −$2,284
- After-tax cash flow
- $8,643/yr
For passive investors: Depreciation is non-cash, so a rental often shows a tax loss while cash-flowing — sheltering income. Rental losses are passive: they offset passive income freely, and up to $25,000/yr can offset ordinary (W-2) income if you actively participate and your MAGI is under $100k (phasing out to $0 by $150k); unused losses carry forward. On sale, claimed depreciation is recaptured at up to 25%, and gains may owe capital-gains tax (a 1031 exchange can defer both). Figures are a year-1 estimate at your 24.0% rate — not tax advice; consult a CPA.
Schools (NCES district)
- District
- Riverhead Central School District
- NCES district ID
- 3624690
- Math proficiency
- 34% ▼ -4.00%
- Reading proficiency
- 48% ▲ 13.00%
- Median HH income
- $61,607
- Composite
- 36.38/100
- National rank
- #4683
- State rank
- #489 of 590 in NY
Livability — Riverside
- Score
- 54/100
- State rank
- #1145
- US rank
- #23895
Category grades
Schools grade is shown separately in the Schools card above.
Census & demographics
- Census place
- Riverside, NY
- Population (ZIP)
- 32,921
Population outlook (Suffolk County) Hauer SSP2
- Today (2025)
- 1,505,262 people
- By 2030
- 1,498,318 · -0.5%
- By 2040
- 1,471,101 · -2.3%
- By 2050
- 1,424,848 · -5.3%
- By 2075
- 1,337,157 · -11.2%
- By 2100
- 1,217,720 · -19.1%
Race, ethnicity, and origin ACS 2023
- Neighborhood character
- Diverse neighborhood (Simpson 0.63)
- Race & ethnicity
- White 52% Hispanic / Latino 29% Two or more races 14% Black 11% Asian 3%
- Hispanic origin (detail)
- Mexican 4%
- Common ancestry
- Romanian 8% Iranian 1% Portuguese 1%
- Foreign-born
- 25% · Canada, Jamaica
- Languages at home
- 68% English-only · Spanish 26% Other Indo-European 3% Russian/Polish/Slavic 2%
Political lean MEDSL · Suffolk
- 2024 margin
- Lean R (+10.0) · D 45.0% · R 55.0%
- 2008→2024 swing
- -16.0pp toward R · 2008: 6.0pp · 2024: -10.0pp
- All cycles
- 2024: R+10.0 2020: R+0.0 2016: R+8.2 2012: D+2.9 2008: D+6.0
Not yet ingested
- Civics
- —
Market trends
- HPI YoY
- ▼ -182.60%
- Current HPI
- 436.7781
- Rent YoY
- —
- Metro
- —
- State GDP YoY
- ▲ 2.60%
- F500 in state
- 92
Industry mix (Fortune 500 HQ in NY)
| Industry | F500 HQs | Revenue |
|---|---|---|
| Financial Services | 10 | $950B |
|
||
| Consumer Goods | 9 | $162B |
|
||
| Insurance | 4 | $225B |
|
||
| Telecommunications | 2 | $144B |
|
||
| Pharmaceuticals | 2 | $112B |
|
||
| Media / Entertainment | 2 | $69B |
|
||
Price history
1 event — show timeline
- 2026-06-02 Listed $170,000 OneKey® MLS as Distributed by MLS Grid
Property tax history
+19.0%/yrLatest (2022): $1,217 · +0.0% YoY. Source: county tax records.
Cash-flow waterfall
monthlySold comps — $/sqft
last 12 mo · ≤1 miLoading sold comps…