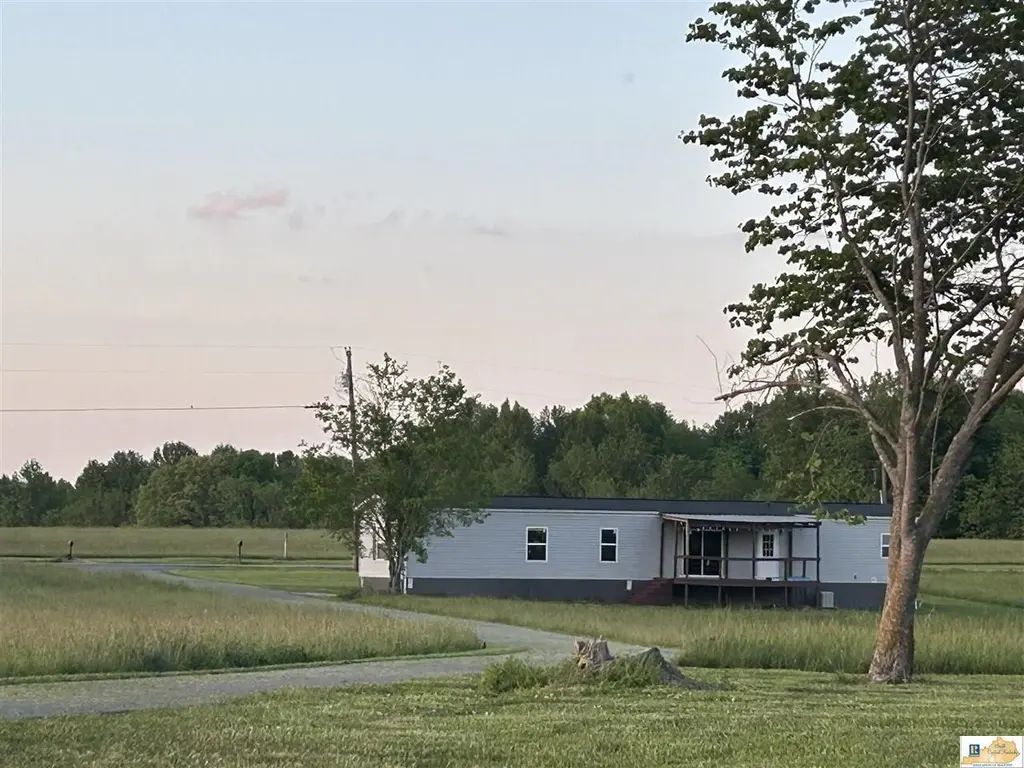
1711 Taylor Ford Rd
Columbia, KY 42728
$139,900F
3 bd · 2.0 ba ·
1,280 sqft ·
Built 2018
· Manufactured
· Active
· 57 DOM
Cashflow @ list (25.0% down · 7.5%)
Estimated rent
$857/mo
Mortgage (P&I)
−$734
Tax + insurance
−$105
HOA
−$0
Vac / Maint / Mgmt
−$180
Net cashflow
$-162/mo
Annual
$-1,942/yr
Cap rate
4.90%
Cash-on-cash
-4.96%
DSCR
0.78
1% rule
0.61%
Cash to close
$39,172
Investor read
- This is a 3-bed/2.0-bath manufactured listed at $140k.
- At list price, monthly cash flow is $-162 ($-2k/yr) — negative.
- To cash-flow at today's rent, offer at most $111k (20.4% below list).
- To meet the 1% rule (rent ≥ 1% of price), the offer needs to be $86k (38.7% below list).
- It's been on market 57 days — a 3% lower offer ($136k) is reasonable based on typical stale-listing flexibility.
- Recommended offer: $86k (38.7% below list) — sets the bar for 1% rule.
- Local home prices are declining (-3.0%/yr); year-one equity from $967 of loan paydown is wiped out by about $4k of value loss. Plan a longer hold.
- Location reads 64/100 on livability (#285 in KY) — a middle-class / working-renter tenant base. Strengths: crime A+, cost of living A+, housing A+; Watch: amenities F, commute F, employment F.
- Adair County (town): math 22% / reading 35% proficiency, ranked #124 of 165 in KY (top 75%) — low school quality limits family demand, transient renter base, plan for 1-2y turnover.
- Zoned schools: Adair County Primary Center (647 students, 70% FRL); Adair County Middle School (math 24% / reading 39%, grade F, #125 of 217 statewide, top 63%, 598 students, 69% FRL); Adair County High School (math 27% / reading 37%, grade F, #97 of 254 statewide, top 46%, 791 students, 63% FRL) — zoned schools average 67% FRL vs 52% district-wide (15 pts higher); higher-poverty schools than district average — tighter screening recommended.
- Market conditions: 100 active listings in the ZIP; 1 units permitted in Adair County in 2024 (0 in 5+ unit buildings).
- Adair County population projected at +9% by 2050 — modest demand growth; plan on rents tracking national, not racing it.
- Current owner paid $80k; list at $140k implies a 75% gain — meaningful room to come down on a strong offer.
- Cap rate 4.9% vs local median 2.9% in Columbia — top-decile yield for the area; either an underpriced asset or a hidden risk that comps aren't pricing in. Stress-test before assuming the spread holds.
Questions for listing agent
- What do current leases actually rent for vs. the listed asking? Can we see a recent rent roll and the last 12 months of T-12 income?
- It's been on market 57 days. Have you received any prior offers? Is the seller open to a 39% concession, seller financing, or rate buy-down credit?
- Is there a deadline driving the sale (1031 exchange, divorce, estate, relocation)? That informs how much negotiation room exists.
- Schools are F-rated, which usually means shorter tenancies and higher turnover. Who's the typical renter profile here, and what's been the actual vacancy rate?
- The area grade is low — what's the realistic commute time and amenity access for the typical tenant pool here? Any planned neighborhood developments (good or bad) we should know about?
- What's the average days-on-market for RENTAL listings here right now (not sales)? A rising rental-DOM trend means longer vacancies and softer asking-rent achievability than the comps imply.
- What's the recent tenant-quality profile in this submarket — average credit score on applications, eviction rate, late-payment / NSF rate, and stable-employment percentage? A property-management company in the area should have these aggregated.
- How much new for-sale + rental construction is in the pipeline within 1–3 miles? Heavy new supply typically softens prices + rents 12–24 months out; constrained supply supports both.
CashFlowRE · CFR-NNDB6ZAQ2J2HJB
· Data 11 h ago
cashflowre.app · 2026-05-29