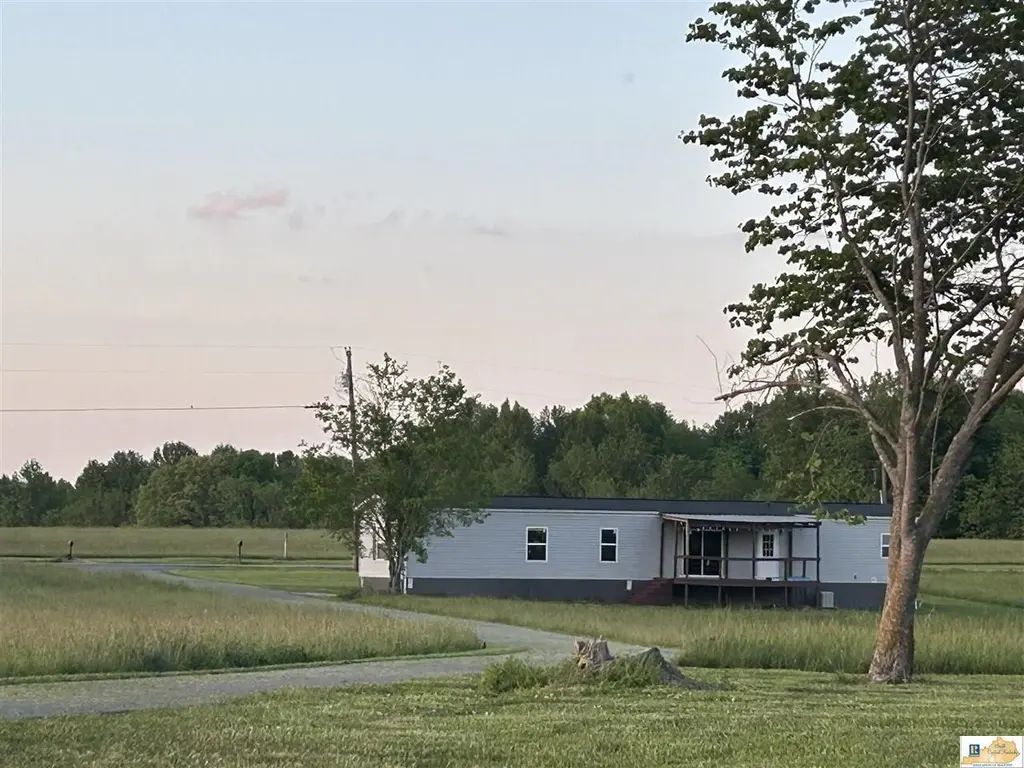
1711 Taylor Ford Rd · Columbia, KY
Flood risk No data
- FEMA flood zone
- —
- Chance of flooding over 30 yrs
- —
- Est. flood insurance / yr
- —
Fire risk No data
- Est. fire insurance / yr
- —
Heat risk No data
- Hot days now (above threshold)
- —
- Hot days in 30 yrs
- —
Wind risk No data
- Chance of severe wind over 30 yrs
- —
Air-quality risk No data
- Unhealthy air days now
- —
- Unhealthy air days in 30 yrs
- —
Risk factors via First Street. Map © Google.
Why this score? — see what drove the D grade
The composite is a weighted blend of 9 inputs, each scored 0–100. Each bar is that input's sub-score; the figure is the points it added to the 100-point composite (weight × sub-score).
- Cash flow +14.9/30.0
- ARV discount +7.5/15.0
- DSCR +4.6/10.0
- Livability +3.2/5.0
- 1% rule +3.0/10.0
- Rent growth +2.5/5.0
- Condition / age +2.5/5.0
- Schools +2.3/10.0
- Appreciation +0.0/10.0
$139,900
🖨 Deal sheet (PDF) 📄 Offer letter ✓ Due diligence
Listing remarks
Don't miss out on your chance to own this great home! At only $139,900, it won't last long! Welcome to your perfect blend of comfort, space, and location! Nestled in a peaceful setting yet conveniently close to town, this beautiful property offers the best of both worlds—privacy and accessibility. This well-appointed home features 3 bedrooms and 2 full bathrooms, with a thoughtfully designed layout that provides both functionality and flexibility. The spacious living areas are ideal for gathering with family or entertaining guests, while the kitchen offers ample cabinetry, a walk in pantry/laundry room, and workspace for everyday living. Step outside and take in the surrounding scen
Key facts
- Ample cabinetry
- Peaceful setting
- Walk in pantry
Tags
Property features AI
Exterior
- Parking: Gravel parking
- Utilities: Well (private); Septic tank
- Home design: Residential mobile home
- Construction: Vinyl siding; Shingle roof
- Exterior features: Deck; Level lot; Located near Green River / Lake Cumberland
Interior
- Kitchen: Dishwasher; Microwave; Range / Oven; Refrigerator; Electric water heater
- Flooring: Carpet; Vinyl
- Bathrooms: 2 full bathrooms (both on the main level)
- Heating & cooling: Central heating (electric); Central air conditioning; Ceiling fan(s)
- Interior features: Walk-in closets; Eat-in kitchen
- Laundry & utility: Washer; Dryer
Neighborhood map
What this means for you Summary
Snapshot
- This is a 3-bed/2.0-bath other listed at $140k.
Deal economics
- At list price, monthly cash flow is $40 ($485/yr) — positive.
- The deal already cash-flows at list — no discount required.
- To meet the 1% rule (rent ≥ 1% of price), the offer needs to be $111k (20.4% below list).
- Recommended offer: $111k (20.4% below list) — sets the bar for 1% rule.
- Cap rate 6.6% vs local median 2.9% in Columbia — top-decile yield for the area; either an underpriced asset or a hidden risk that comps aren't pricing in. Stress-test before assuming the spread holds.
Location & tenants
- Location reads 64/100 on livability (#285 in KY) — a middle-class / working-renter tenant base. Strengths: crime A+, cost of living A+, housing A+; Watch: amenities F, commute F, employment F.
- Adair County (town): math 22% / reading 35% proficiency, ranked #124 of 165 in KY (top 75%) — low school quality limits family demand, transient renter base, plan for 1-2y turnover.
- Zoned schools: Adair County Primary Center (647 students, 70% FRL); Adair County Middle School (math 24% / reading 39%, grade F, #125 of 217 statewide, top 63%, 598 students, 69% FRL); Adair County High School (math 27% / reading 37%, grade F, #97 of 254 statewide, top 46%, 791 students, 63% FRL) — zoned schools average 67% FRL vs 52% district-wide (15 pts higher); higher-poverty schools than district average — tighter screening recommended.
- Market conditions: 100 active listings in the ZIP; 1 units permitted in Adair County in 2024 (0 in 5+ unit buildings).
Forward outlook
- Local home prices are declining (-3.0%/yr); year-one equity from $967 of loan paydown is wiped out by about $4k of value loss. Plan a longer hold.
- Adair County population projected at +9% by 2050 — modest demand growth; plan on rents tracking national, not racing it.
Negotiation context
- It's been on market 57 days — a 3% lower offer ($136k) is reasonable based on typical stale-listing flexibility.
- Current owner paid $80k; list at $140k implies a 75% gain — meaningful room to come down on a strong offer.
Questions for the listing agent
- It's been on market 57 days. Have you received any prior offers? Is the seller open to a 20% concession, seller financing, or rate buy-down credit?
- Is there a deadline driving the sale (1031 exchange, divorce, estate, relocation)? That informs how much negotiation room exists.
- Schools are F-rated, which usually means shorter tenancies and higher turnover. Who's the typical renter profile here, and what's been the actual vacancy rate?
- The area grade is low — what's the realistic commute time and amenity access for the typical tenant pool here? Any planned neighborhood developments (good or bad) we should know about?
- What's the average days-on-market for RENTAL listings here right now (not sales)? A rising rental-DOM trend means longer vacancies and softer asking-rent achievability than the comps imply.
- What's the recent tenant-quality profile in this submarket — average credit score on applications, eviction rate, late-payment / NSF rate, and stable-employment percentage? A property-management company in the area should have these aggregated.
- How much new for-sale + rental construction is in the pipeline within 1–3 miles? Heavy new supply typically softens prices + rents 12–24 months out; constrained supply supports both.
Investment metrics
- 1% rule
- 0.80% ✗
- Cap rate
- 6.64%
- Cash-on-cash
- 1.24%
- DSCR
- 1.06
- GRM
- 10.5
CMA / ARV
No comps found within radius.
Projected returns pro-forma
-3.0% appreciation · 3.0% rent growth · sell at horizon
- IRR
- -14.4%
- Equity multiple
- 0.49×
- Total profit
- $-20,155
- Equity at exit
- $20,860
- IRR
- -5.7%
- Equity multiple
- 0.63×
- Total profit
- $-14,484
- Equity at exit
- $12,096
Cash invested: $39,172 (down + closing). Projections, not guarantees.
Landlord ↔ Tenant lean methodology
- Overall (STATE)
- 83 Strongly Landlord-Friendly
- State Kentucky
- 83 Strongly Landlord-Friendly · R+16
- County
- — inherits STATE
- City
- — inherits STATE
ZIP-level market 42728
- Active inventory
- 100
- Price-to-rent
- 10.5×
Monthly cashflow live
- Estimated rent
- $1,113 medium interval (Pro) →
- Mortgage (P&I)
- −$734
- Tax from tax record
- −$47 /mo · $566/yr
- Insurance
- −$58
- HOA
- −$0
- Vacancy / Maint / Mgmt
- −$234
- Net cashflow
- $40
Break-even live
Sensitivity live
| Price | -10% $120 | -5% $80 | +0% $40 | +5% $1 | +10% $-39 |
|---|---|---|---|---|---|
| Rent | -10% $-48 | -5% $-4 | +0% $40 | +5% $84 | +10% $128 |
| Rate | -1.0pp $111 | -0.5pp $76 | base $40 | +0.5pp $4 | +1.0pp $-33 |
UW: 25.0% down · 7.5% · 30yr · 1.5% tax · 5.0% vac · 8.0% maint · 8.0% mgmt
Financing live
Cash to close
- Down payment
- $34,975
- Closing costs
- $4,197
- Reserves months
- —
- Total cash needed
- —
Loan-product check · same deal, 3 products live
Conventional
25% down · 7.5% · 30yr
- Down + closing
- —
- Monthly P&I
- —
- Monthly cashflow
- —
- DSCR
- —
- Eligible?
- —
Personal DTI + credit; lowest rate.
DSCR
20% down · 8.5% · 30yr
- Down + closing
- —
- Monthly P&I
- —
- Monthly cashflow
- —
- DSCR
- —
- Eligible?
- —
No personal income docs; deal must DSCR.
Hard money
10% down · 12.0% · 12mo
- Down + closing
- —
- Monthly P&I
- —
- Monthly cashflow
- —
- DSCR
- —
- Eligible?
- —
Short-term bridge; refi at stabilization.
Listing history 20 events
-
2026-06-22days on market $139,900 Active 57 DOM
-
2026-06-21days on market $139,900 Active 56 DOM
-
2026-06-21days on market $139,900 Active 55 DOM
-
2026-06-18days on market $139,900 Active 53 DOM
-
2026-06-17days on market $139,900 Active 52 DOM
-
2026-06-16days on market $139,900 Active 51 DOM
-
2026-06-15days on market $139,900 Active 50 DOM
-
2026-06-13days on market $139,900 Active 48 DOM
-
2026-06-12days on market $139,900 Active 47 DOM
-
2026-06-09days on market $139,900 Active 44 DOM
-
2026-06-08days on market $139,900 Active 43 DOM
-
2026-06-07days on market $139,900 Active 42 DOM
-
2026-06-07days on market $139,900 Active 41 DOM
-
2026-06-04days on market $139,900 Active 38 DOM
-
2026-06-02days on market $139,900 Active 37 DOM
-
2026-06-01days on market $139,900 Active 36 DOM
-
2026-05-31days on market $139,900 Active 35 DOM
-
2026-05-31days on market $139,900 Active 34 DOM
-
2026-04-26$139,900 Active
-
2026-04-01soldstatus $80,000
ⓘ Source: listings_history table (triggers on properties + properties_extension) + one-shot
backfill from property_details.listing_events for pre-trigger history.
Tax reassessment forecast KY · Resets to sale price
- Current annual tax
- $566 · $47/mo
- Projected year-2 tax
- $1,203 · $100/mo
- Expected delta
- +$637/yr (+$53/mo · 112.6%)
ⓘ Screening estimate from a state-policy table — verify with the county assessor before closing.
Nearby sold comps map
Loading sold comps map…
Walkable amenities ~0.75 mi
Loading nearby amenities…
Taxation est. · year 1
- Rental income
- $13,360
- − Mortgage interest
- −$7,837
- − Property taxes
- −$566
- − Insurance
- −$700
- − Repairs & maintenance
- −$1,069
- − Management
- −$1,069
- − Depreciation
- −$4,070
- Taxable loss
- −$1,949
- Est. tax savings @ 24.0%
- +$468
- After-tax cash flow
- $953/yr
For passive investors: Depreciation is non-cash, so a rental often shows a tax loss while cash-flowing — sheltering income. Rental losses are passive: they offset passive income freely, and up to $25,000/yr can offset ordinary (W-2) income if you actively participate and your MAGI is under $100k (phasing out to $0 by $150k); unused losses carry forward. On sale, claimed depreciation is recaptured at up to 25%, and gains may owe capital-gains tax (a 1031 exchange can defer both). Figures are a year-1 estimate at your 24.0% rate — not tax advice; consult a CPA.
Schools (NCES district)
- District
- Adair County
- NCES district ID
- 2100030
- Math proficiency
- 22% ▼ -28.00%
- Reading proficiency
- 35% ▼ -19.00%
- Median HH income
- $33,174
- Composite
- 23.3/100
- National rank
- #7921
- State rank
- #124 of 165 in KY
Livability — Columbia
- Score
- 64/100
- State rank
- #285
- US rank
- #13803
Category grades
Schools grade is shown separately in the Schools card above.
Census & demographics
- Population (ZIP)
- 16,108
Population outlook (Adair County) Hauer SSP2
- Today (2025)
- 20,359 people
- By 2030
- 20,856 · +2.4%
- By 2040
- 21,678 · +6.5%
- By 2050
- 22,107 · +8.6%
- By 2075
- 22,740 · +11.7%
- By 2100
- 21,840 · +7.3%
Race, ethnicity, and origin ACS 2023
- Neighborhood character
- Predominantly White (90%)
- Race & ethnicity
- White 90% Two or more races 6% Hispanic / Latino 4% Black 2%
- Common ancestry
- Serbian 1% Italian 1% Lithuanian 1%
- Foreign-born
- 4% · Canada
- Languages at home
- 96% English-only · Spanish 2% French/Haitian/Cajun 1%
Political lean MEDSL · Adair
- 2024 margin
- Solid R (+71.2) · D 14.0% · R 85.2%
- 2008→2024 swing
- -18.5pp toward R · 2008: -52.7pp · 2024: -71.2pp
- All cycles
- 2024: R+71.2 2020: R+67.1 2016: R+64.6 2012: R+55.0 2008: R+52.7
Not yet ingested
- Civics
- —
Market trends
- HPI YoY
- ▼ -128.69%
- Current HPI
- 169.064
- Rent YoY
- —
- Metro
- —
- State GDP YoY
- ▲ 1.81%
- F500 in state
- 4
Industry mix (Fortune 500 HQ in KY)
| Industry | F500 HQs | Revenue |
|---|---|---|
| Healthcare | 1 | $118B |
|
||
| Food / Beverage | 1 | $7B |
|
||
Price history
+74.9% since first listed2 events — show timeline
- 2026-04-26 Listed $139,900 SCKMLSKY
- 2026-04-01 Sold (Public Records) $80,000 Public Records
Property tax history
+1.9%/yrLatest (2025): $566 · +2.1% YoY. Source: county tax records.
Cash-flow waterfall
monthlySold comps — $/sqft
last 12 mo · ≤1 miLoading sold comps…