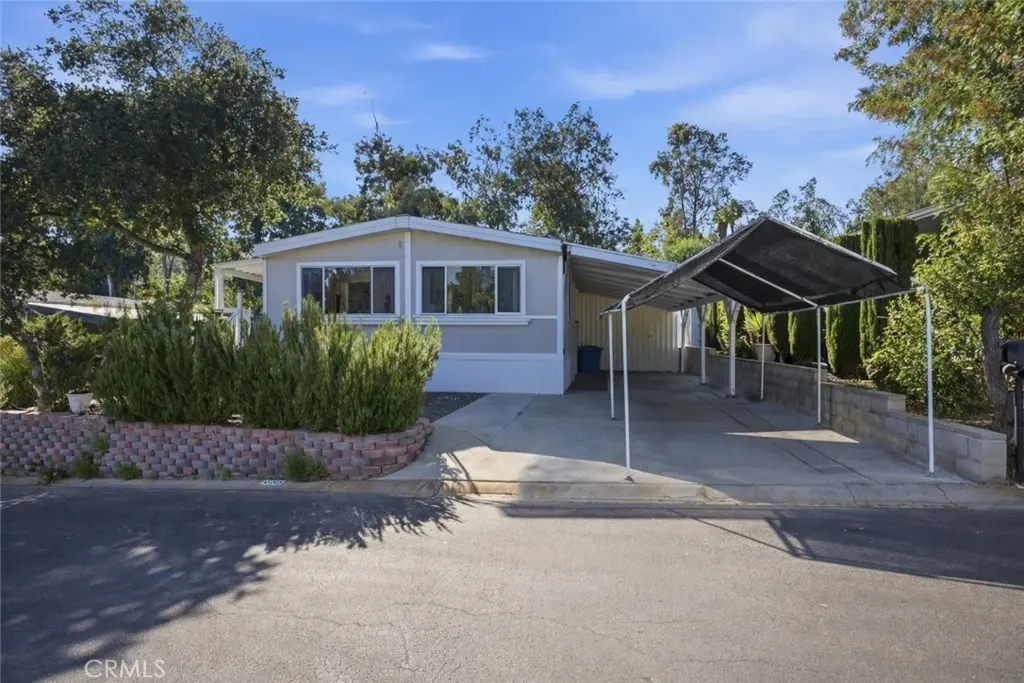
23777 Mulholland Hwy #203
Calabasas, CA 91302
$299,000B-
3 bd · 2.0 ba ·
1,536 sqft ·
Built 1974
· Manufactured
· Active
· 21 DOM
Cashflow @ list (25.0% down · 7.5%)
Estimated rent
$5,712/mo
Mortgage (P&I)
−$1,568
Tax + insurance
−$498
HOA
−$0
Vac / Maint / Mgmt
−$1,199
Net cashflow
$2,446/mo
Annual
$29,352/yr
Cap rate
16.11%
Cash-on-cash
35.06%
DSCR
2.56
1% rule
1.91%
Cash to close
$83,720
Investor read
- This is a 3-bed/2.0-bath manufactured listed at $299k.
- At list price, monthly cash flow is $2k ($29k/yr) — positive.
- The deal already cash-flows at list — no discount required.
- Meets the 1% rule at list price ($6k rent vs $299k).
- It's been on market 21 days — a 2% lower offer ($295k) is reasonable based on typical stale-listing flexibility.
- Recommended offer: $295k (1.5% below list) — sets the bar for market timing.
- Local home prices are declining (-3.0%/yr); year-one equity from $2k of loan paydown is wiped out by about $9k of value loss. Plan a longer hold.
- Location reads 57/100 on livability (#756 in CA) — a working-class tenant base; expect higher turnover. Strengths: employment A+, schools A-, crime A-; Watch: amenities F, commute F, cost of living F.
- Las Virgenes Unified (suburban): math 55% / reading 70% proficiency, ranked #58 of 517 in CA (top 11%) — acceptable for families but not a draw, mixed tenant base, ~2y average lease; only 6% free/reduced lunch — higher-income household profile.
- Market conditions: Rents soft (-2.9%/yr); 223 active listings in the ZIP; 14 comparable units currently listed for rent nearby; rentals lingering (median 44d on market — plan ~5-8 weeks vacancy on turnover, expect pricing pressure); 50% of comp listings sitting > 30 days — soft ceiling on asking rent; high-income renter base; 19,697 units permitted in Los Angeles County in 2024 (9,426 in 5+ unit buildings).
- Los Angeles County population projected at +9% by 2050 — modest demand growth; plan on rents tracking national, not racing it.
- 6 sale attempts since 16y ago with the ask held roughly flat each time — persistent listings suggest the price (not the market) is what's stuck; bring a comps-based counter.
- Current owner paid $18k; list at $299k implies a 1561% gain — meaningful room to come down on a strong offer.
- At projected returns (-3.0% appreciation + 0.0% rent growth), your $84k cash investment doubles in ~4 years — after that, you're playing with house money.
- Climate carrying-cost: severe wildfire risk — expect insurance premiums to compound above CPI over the hold.
- Cap rate 16.1% vs local median 2.2% in Calabasas — top-decile yield for the area; either an underpriced asset or a hidden risk that comps aren't pricing in. Stress-test before assuming the spread holds.
- This rent runs 37% of the median local income ($186k/yr) — at the standard rent-burdened threshold; future hikes will face affordability resistance.
Questions for listing agent
- Built in 1974 — when were the roof, HVAC, electrical panel, plumbing, and water heater last replaced?
- Is there a deadline driving the sale (1031 exchange, divorce, estate, relocation)? That informs how much negotiation room exists.
- Schools are A-rated — typically a magnet for longer-tenancy family renters. What's the average tenant stay here, and is there a school-zone premium baked into asking?
- What's the average days-on-market for RENTAL listings here right now (not sales)? A rising rental-DOM trend means longer vacancies and softer asking-rent achievability than the comps imply.
- What's the recent tenant-quality profile in this submarket — average credit score on applications, eviction rate, late-payment / NSF rate, and stable-employment percentage? A property-management company in the area should have these aggregated.
- How much new for-sale + rental construction is in the pipeline within 1–3 miles? Heavy new supply typically softens prices + rents 12–24 months out; constrained supply supports both.
CashFlowRE · CFR-NNF3TM4NVTBZP5
· Data 2 days ago
cashflowre.app · 2026-05-29