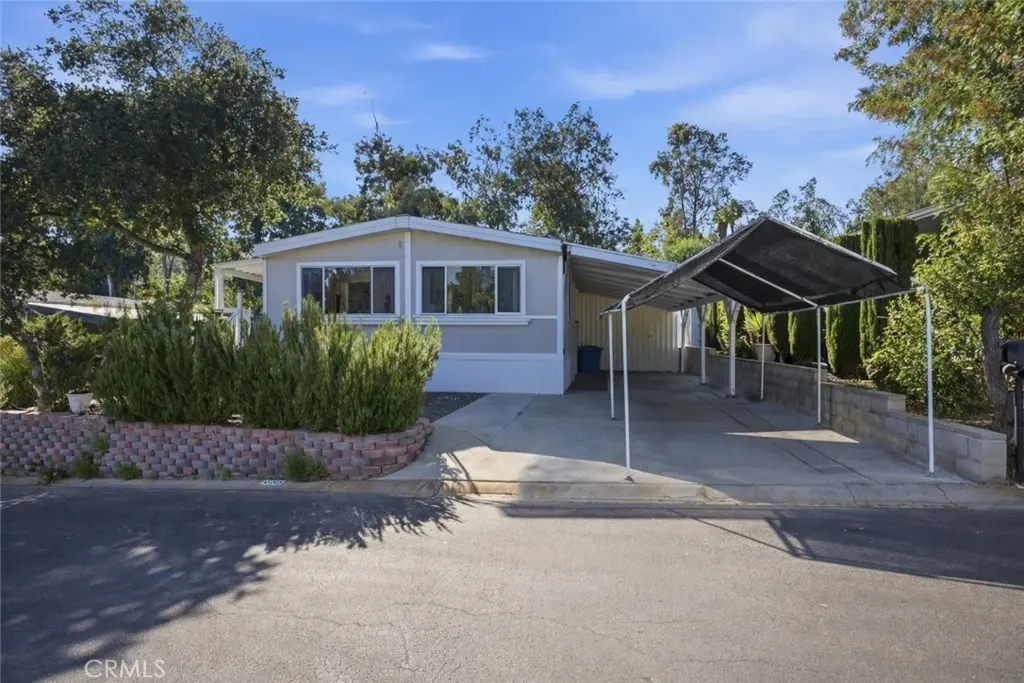
23777 Mulholland Hwy #203 · Calabasas, CA
Flood risk 1/10 · Minimal
- FEMA flood zone
- X (unshaded)
- Chance of flooding over 30 yrs
- 0.0%
- Est. flood insurance / yr
- $507 – $1,088
Fire risk 8/10 · Major
- Est. fire insurance / yr
- $659 – $1,223
Heat risk 4/10 · Minor
- Hot days now (above 98°F)
- 7 days/yr
- Hot days in 30 yrs
- 21 days/yr
Wind risk 1/10 · Minimal
- Chance of severe wind over 30 yrs
- —
Air-quality risk 5/10 · Moderate
- Unhealthy air days now
- 6 days/yr
- Unhealthy air days in 30 yrs
- 8 days/yr
Risk factors via First Street. Map © Google.
Why this score? — see what drove the B- grade
The composite is a weighted blend of 9 inputs, each scored 0–100. Each bar is that input's sub-score; the figure is the points it added to the 100-point composite (weight × sub-score).
- Cash flow +30.0/30.0
- 1% rule +10.0/10.0
- DSCR +10.0/10.0
- Schools +6.0/10.0
- ARV discount +5.7/15.0
- Livability +2.9/5.0
- Condition / age +2.5/5.0
- Rent growth +1.8/5.0
- Appreciation +0.0/10.0
$299,000
🖨 Deal sheet 📄 Offer letter ✓ Due diligence
Listing remarks
Nestled within one of the area's most desirable communities, this beautifully updated 3-bedroom, 2-bath manufactured home offers the perfect blend of comfort, privacy, serene surroundings, and beautiful mountain views. Spanning approximately 1,536 sq. ft. , the home features a spacious open-concept layout with a newly remodeled kitchen showcasing stainless steel appliances, subway tile backsplash, and picturesque mountain views from the kitchen window. The expansive living and dining areas are filled with natural light from large windows that perfectly frame the surrounding scenery. The oversized primary suite offers two closets, while the indoor laundry room provides additional storage spa
Key facts
- Newer roof
- Large private patio
- Community pool
Tags
Property features AI
Finance
- Other: Park name: Calabasas Village; Community features include park and dog park
- Financial info: Land lease required (monthly); Land lease amount: $2,500 per month (seller provided source); Rent may include trash, water, sewer, and cable TV
- HOA & community: Community amenities: pool, club house, gym/exercise room, tennis and sport courts, playground, dog park, picnic area, outdoor cooking area, banquet/meeting/card rooms, recreational multipurpose room; Association amenities also include sauna, on-site property management, security, cable TV, water and sewer; Pets permitted (manager approval required)
Exterior
- Parking: Covered parking; Tandem covered parking; Driveway; Detached carport; Community/park parking (Calabasas Village)
- Security: Onsite property management; Association provides security
- Utilities: Public/district water; Public sewer; Sewer connected; Water connected; Electricity connected; Cable connected
- Home design: Manufactured/mobile home (model: National); Single-story; Mobile dimensions approximately 24' x 64'; Mobile home remains on site; Faces east entrance via private paved road
- Construction: Year-built provided by builder
- Exterior features: Deck; Patio; In-ground community pool; Has view; 0–1 unit per acre lot characteristic
Interior
- Kitchen: Remodeled kitchen; Granite counters; Gas range; Dishwasher; Garbage disposal
- Bedrooms: Primary bedroom on main level
- Flooring: Laminate flooring
- Bathrooms: Two full bathrooms; Bathtub; Shower-in-tub; Jetted tub
- Heating & cooling: Central heating (central furnace); Central air conditioning
- Interior features: One-level home; Entry at first level; All bedrooms on ground level; Primary bedroom; Primary bathroom
- Laundry & utility: Inside laundry in an individual room; Washer included; Dryer included
Neighborhood map
What this means for you Summary
Snapshot
- This is a 3-bed/2.0-bath manufactured listed at $299k.
Deal economics
- At list price, monthly cash flow is $2k ($29k/yr) — positive.
- The deal already cash-flows at list — no discount required.
- Meets the 1% rule at list price ($6k rent vs $299k).
- Recommended offer: $295k (1.5% below list) — sets the bar for market timing.
- Cap rate 16.1% vs local median 2.2% in Calabasas — top-decile yield for the area; either an underpriced asset or a hidden risk that comps aren't pricing in. Stress-test before assuming the spread holds.
Location & tenants
- Location reads 57/100 on livability (#756 in CA) — a working-class tenant base; expect higher turnover. Strengths: employment A+, schools A-, crime A-; Watch: amenities F, commute F, cost of living F.
- Las Virgenes Unified (suburban): math 55% / reading 70% proficiency, ranked #58 of 517 in CA (top 11%) — acceptable for families but not a draw, mixed tenant base, ~2y average lease; only 6% free/reduced lunch — higher-income household profile.
- Market conditions: Rents soft (-2.9%/yr); 223 active listings in the ZIP; 14 comparable units currently listed for rent nearby; rentals lingering (median 44d on market — plan ~5-8 weeks vacancy on turnover, expect pricing pressure); 50% of comp listings sitting > 30 days — soft ceiling on asking rent; high-income renter base; 19,697 units permitted in Los Angeles County in 2024 (9,426 in 5+ unit buildings).
- This rent runs 37% of the median local income ($186k/yr) — at the standard rent-burdened threshold; future hikes will face affordability resistance.
Forward outlook
- Local home prices are declining (-3.0%/yr); year-one equity from $2k of loan paydown is wiped out by about $9k of value loss. Plan a longer hold.
- Los Angeles County population projected at +9% by 2050 — modest demand growth; plan on rents tracking national, not racing it.
- At projected returns (-3.0% appreciation + 0.0% rent growth), your $84k cash investment doubles in ~4 years — after that, you're playing with house money.
Negotiation context
- It's been on market 21 days — a 2% lower offer ($295k) is reasonable based on typical stale-listing flexibility.
- 6 sale attempts since 16y ago with the ask held roughly flat each time — persistent listings suggest the price (not the market) is what's stuck; bring a comps-based counter.
- Current owner paid $18k; list at $299k implies a 1561% gain — meaningful room to come down on a strong offer.
Risks & watch-outs
- Climate carrying-cost: severe wildfire risk — expect insurance premiums to compound above CPI over the hold.
Questions for the listing agent
- Built in 1974 — when were the roof, HVAC, electrical panel, plumbing, and water heater last replaced?
- Is there a deadline driving the sale (1031 exchange, divorce, estate, relocation)? That informs how much negotiation room exists.
- Schools are A-rated — typically a magnet for longer-tenancy family renters. What's the average tenant stay here, and is there a school-zone premium baked into asking?
- What's the average days-on-market for RENTAL listings here right now (not sales)? A rising rental-DOM trend means longer vacancies and softer asking-rent achievability than the comps imply.
- What's the recent tenant-quality profile in this submarket — average credit score on applications, eviction rate, late-payment / NSF rate, and stable-employment percentage? A property-management company in the area should have these aggregated.
- How much new for-sale + rental construction is in the pipeline within 1–3 miles? Heavy new supply typically softens prices + rents 12–24 months out; constrained supply supports both.
Investment metrics
- 1% rule
- 1.91% ✓
- Cap rate
- 16.11%
- Cash-on-cash
- 35.06%
- DSCR
- 2.56
- GRM
- 4.4
CMA / ARV
- ARV (median comp)
- $287,472
- List price
- $299,000
- Delta
- 4.01%
- Verdict
- FAIR
- Comps
- 20 within 1.0 mi
Show comp detail 10 sales within ~0.75 mi
| Address | Dist | Beds/Ba | Sqft | Sold | Price | $/sf | Match |
|---|---|---|---|---|---|---|---|
| 23777 Mulholland Hwy #177 | 0.11mi | 3/3.5 | 1,536 (0%) | 0mo | $260,000 | $169 | 89 |
| 23777 Mulholland Hwy #86 | 0.00mi | 3/2.0 | 1,440 (-6%) | 2mo | $290,000 | $201 | 88 |
| 23777 Mulholland Hwy #65 | 0.00mi | 3/2.0 | 1,560 (+2%) | 11mo | $469,000 | $301 | 88 |
| 23777 Mulholland Hwy #201 | 0.00mi | 4/2.0 (+1) | 1,539 (+0%) | 14mo | $342,500 | $223 | 83 |
| 23777 Mulholland Hwy #42 | 0.13mi | 2/2.0 (-1) | 1,536 (0%) | 11mo | $215,000 | $140 | 80 |
| 23777 Mulholland Hwy Spc 19 | 0.11mi | 3/2.0 | 1,440 (-6%) | 13mo | $270,000 | $188 | 74 |
| 23777 MULHOLLAND HWY SPC 149 | 0.13mi | 2/2.0 (-1) | 1,536 (0%) | 23mo | $250,000 | $163 | 70 |
| 23777 Mulholland Hwy #49 | 0.05mi | 2/2.0 (-1) | 1,440 (-6%) | 20mo | $299,000 | $208 | 65 |
| 23777 Mulholland Hwy #17 | 0.11mi | 2/3.0 (-1) | 1,486 (-3%) | 20mo | $599,000 | $403 | 64 |
| 23777 Mulholland Hwy #187 | 0.11mi | 2/2.0 (-1) | 1,440 (-6%) | 21mo | $235,000 | $163 | 62 |
Match score weights: distance 35% · size 25% · config 20% · recency 20%. Top-matched comps best support the ARV.
Projected returns pro-forma
-3.0% appreciation · 0.0% rent growth · sell at horizon
- IRR
- 27.2%
- Equity multiple
- 2.08×
- Total profit
- $90,681
- Equity at exit
- $44,582
- IRR
- 32.9%
- Equity multiple
- 3.57×
- Total profit
- $215,223
- Equity at exit
- $25,852
Cash invested: $83,720 (down + closing). Projections, not guarantees.
Landlord ↔ Tenant lean methodology
- Overall (STATE)
- 18 Strongly Tenant-Friendly
- State California
- 18 Strongly Tenant-Friendly · D+13
- County
- — inherits STATE
- City
- — inherits STATE
ZIP-level market 91302
- Rents YoY
- -2.9%
- Active inventory
- 223
- Price-to-rent
- 4.4×
Monthly cashflow live
- Estimated rent
- $5,712 high interval (Pro) →
- Mortgage (P&I)
- −$1,568
- Tax est. 1.5%
- −$374 /mo · $4,485/yr
- Insurance
- −$125
- HOA
- −$0
- Vacancy / Maint / Mgmt
- −$1,199
- Net cashflow
- $2,446
Break-even live
UW: 25.0% down · 7.5% · 30yr · 1.5% tax · 5.0% vac · 8.0% maint · 8.0% mgmt
Financing live
Cash to close
- Down payment
- $74,750
- Closing costs
- $8,970
- Reserves months
- —
- Total cash needed
- —
Loan-product check · same deal, 3 products live
Conventional
25% down · 7.5% · 30yr
- Down + closing
- —
- Monthly P&I
- —
- Monthly cashflow
- —
- DSCR
- —
- Eligible?
- —
Personal DTI + credit; lowest rate.
DSCR
20% down · 8.5% · 30yr
- Down + closing
- —
- Monthly P&I
- —
- Monthly cashflow
- —
- DSCR
- —
- Eligible?
- —
No personal income docs; deal must DSCR.
Hard money
10% down · 12.0% · 12mo
- Down + closing
- —
- Monthly P&I
- —
- Monthly cashflow
- —
- DSCR
- —
- Eligible?
- —
Short-term bridge; refi at stabilization.
Rent comps 14 comps
| Address | Beds | Baths | Sqft | Rent | $/sqft | DOM | Units | Dist |
|---|---|---|---|---|---|---|---|---|
| 24621 Senda Salvia Calabasas, CA | 3.0 | 3.0 | 1591 | $6,200 | $3.90 | 22d | 1 | 0.52mi |
| 24709 Via del Llano Calabasas, CA | 4.0 | 3.0 | 1931 | $7,000 | $3.63 | 18d | 1 | 0.62mi |
| 3539 Canon Dr Topanga, CA | 4.0 | 3.0 | 1891 | $9,000 | $4.76 | 43d | 1 | 0.64mi |
| 24765 Via del Llano Calabasas, CA | 3.0 | 2.5 | 1591 | $5,480 | $3.44 | 43d | 1 | 0.69mi |
| 3717 Calle Joaquin Calabasas, CA | 3.0 | 2.5 | 1575 | $6,500 | $4.13 | 43d | 1 | 0.87mi |
| 24655 Park Miramar Calabasas, CA | 2.0 | 2.0 | 1200 | $5,995 | $5.00 | 17d | 1 | 0.90mi |
| 4606 Park Granada #11 Calabasas, CA | 2.0 | 2.0 | 1054 | $2,795 | $2.65 | 43d | 1 | 1.16mi |
| 23647 Park Capri #87 Calabasas, CA | 3.0 | 2.0 | 1290 | $3,900 | $3.02 | 43d | 1 | 1.19mi |
| 4140 Meadow Lark Dr Calabasas, CA | 3.0 | 3.0 | 1745 | $5,750 | $3.30 | 43d | 1 | 1.23mi |
| 4140 Meadow Lark Dr Calabasas, CA | 3.0 | 2.5 | 1750 | $5,400 | $3.09 | 18d | 1 | 1.23mi |
| 23635 Park Capri #31 Calabasas, CA | 2.0 | 2.0 | 1054 | $2,975 | $2.82 | 24d | 1 | 1.25mi |
| 4732 Park Granada #221 Calabasas, CA | 2.0 | 2.0 | 1054 | $2,800 | $2.66 | 44d | 1 | 1.25mi |
| 23637 Park Capri #34 Calabasas, CA | 2.0 | 2.0 | 1054 | $3,800 | $3.61 | 24d | 1 | 1.25mi |
| 4648 Park Granada #170 Calabasas, CA | 3.0 | 2.0 | 1290 | $4,200 | $3.26 | 24d | 1 | 1.25mi |
Listing history 25 events
-
2026-06-18days on market $299,000 Active 21 DOM
-
2026-06-17days on market $299,000 Active 20 DOM
-
2026-06-16days on market $299,000 Active 19 DOM
-
2026-06-15days on market $299,000 Active 18 DOM
-
2026-06-13days on market $299,000 Active 16 DOM
-
2026-06-13days on market $299,000 Active 15 DOM
-
2026-06-09days on market $299,000 Active 12 DOM
-
2026-06-08days on market $299,000 Active 11 DOM
-
2026-06-07days on market $299,000 Active 10 DOM
-
2026-06-04days on market $299,000 Active 7 DOM
-
2026-06-03days on market $299,000 Active 6 DOM
-
2026-06-02days on market $299,000 Active 5 DOM
-
2026-06-01days on market $299,000 Active 4 DOM
-
2026-05-31days on market $299,000 Active 3 DOM
-
2026-05-08price $299,000 1011-char remark
-
2026-05-01$329,000 Active 1011-char remark
-
2026-04-30historical
-
2026-04-23$600,000 Active
-
2026-04-23historical
-
2026-03-28$329,999 Active
-
2026-03-28historical
-
2026-03-27$329,999 Active
-
2011-01-07soldstatus $18,000 Closed
-
2010-12-09status Backup Offers Accepted
-
2010-11-16$24,000 Active
ⓘ Source: listings_history table (triggers on properties + properties_extension) + one-shot
backfill from property_details.listing_events for pre-trigger history.
Climate risk First Street
- Flood 1/10 Low FEMA zone X (unshaded) · 0% chance over 30 yrs
- Wildfire 8/10 Severe
- Heat 4/10 Moderate 7 d/yr ≥98°F today · 21 d/yr by 30 yrs out
- Wind 1/10 Low
- Air quality 5/10 Major 6 unhealthy d/yr today · 8 by 30 yrs out
Nearby sold comps map
Loading sold comps map…
Walkable amenities ~0.75 mi
Loading nearby amenities…
Taxation est. · year 1
- Rental income
- $68,541
- − Mortgage interest
- −$16,749
- − Property taxes
- −$4,485
- − Insurance
- −$1,495
- − Repairs & maintenance
- −$5,483
- − Management
- −$5,483
- − Depreciation
- −$8,698
- Taxable income
- $26,148
- Est. tax owed @ 24.0%
- −$6,275
- After-tax cash flow
- $23,076/yr
For passive investors: Depreciation is non-cash, so a rental often shows a tax loss while cash-flowing — sheltering income. Rental losses are passive: they offset passive income freely, and up to $25,000/yr can offset ordinary (W-2) income if you actively participate and your MAGI is under $100k (phasing out to $0 by $150k); unused losses carry forward. On sale, claimed depreciation is recaptured at up to 25%, and gains may owe capital-gains tax (a 1031 exchange can defer both). Figures are a year-1 estimate at your 24.0% rate — not tax advice; consult a CPA.
Schools (NCES district)
- District
- Las Virgenes Unified
- NCES district ID
- 0621000
- Math proficiency
- 55% ▼ -4.00%
- Reading proficiency
- 70% ▬ 0.00%
- Median HH income
- $118,374
- Composite
- 59.63/100
- National rank
- #907
- State rank
- #58 of 517 in CA
Livability — Calabasas
- Score
- 57/100
- State rank
- #756
- US rank
- #22060
Category grades
Schools grade is shown separately in the Schools card above.
Census & demographics
- Census place
- Calabasas, CA
- County
- Los Angeles County · 9,444,647 people
- City population
- 25,569
- Metro
- Los Angeles-Long Beach-Anaheim, CA
- Population (ZIP)
- 25,569
- Household income
- $185,636
- Rent vs Own
- Severe rent burden
- 1222.0
Population outlook (Los Angeles County) Hauer SSP2
- Today (2025)
- 10,940,515 people
- By 2030
- 11,256,481 · +2.9%
- By 2040
- 11,729,929 · +7.2%
- By 2050
- 11,948,407 · +9.2%
- By 2075
- 11,818,114 · +8.0%
- By 2100
- 10,842,928 · -0.9%
Race, ethnicity, and origin ACS 2023
- Neighborhood character
- Predominantly White (74%)
- Race & ethnicity
- White 74% Asian 11% Two or more races 8% Hispanic / Latino 7% Black 3%
- Hispanic origin (detail)
- Mexican 3%
- Common ancestry
- Scotch-Irish 7% Romanian 3% Italian 3%
- Foreign-born
- 25% · China, Canada, South Korea
- Languages at home
- 72% English-only · Other Indo-European 10% Russian/Polish/Slavic 4% Spanish 4%
Political lean MEDSL · Los Angeles
- 2024 margin
- Solid D (+32.9) · D 64.8% · R 31.9% · Other 3.3%
- 2008→2024 swing
- -7.4pp toward R · 2008: 40.4pp · 2024: 32.9pp
- All cycles
- 2024: D+32.9 2020: D+44.2 2016: D+48.0 2012: D+40.0 2008: D+40.4
Not yet ingested
- Civics
- —
Market trends
- HPI YoY
- ▼ -483.62%
- Current HPI
- 332.6271
- Rent YoY
- ▼ -2.89%
- Metro
- Los Angeles-Long Beach-Anaheim, CA
- State GDP YoY
- ▲ 3.21%
- F500 in state
- 116
Industry mix (Fortune 500 HQ in CA)
| Industry | F500 HQs | Revenue |
|---|---|---|
| Technology | 27 | $1,492B |
|
||
| Financial Services | 3 | $174B |
|
||
| Retail | 3 | $44B |
|
||
| Insurance | 3 | $26B |
|
||
| Media / Entertainment | 2 | $115B |
|
||
| Pharmaceuticals / Biotech | 2 | $62B |
|
||
Price history
+1145.8% since first listed13 events — show timeline
- 2026-05-28 Listed $299,000 CRMLS
- 2026-05-23 Listing Removed — CRMLS
- 2026-05-08 Price Changed $299,000 CRMLS
- 2026-05-01 Listed $329,000 CRMLS
- 2026-04-30 Listing Removed — CRMLS
- 2026-04-23 Listed $600,000 CRMLS
- 2026-04-23 Listing Removed — CRMLS
- 2026-03-28 Listing Removed — CRMLS
- 2026-03-28 Listed $329,999 CRMLS
- 2026-03-27 Listed $329,999 CRMLS
- 2011-01-07 Sold (MLS) $18,000 CRMLS
- 2010-12-09 Pending — CRMLS
- 2010-11-16 Listed $24,000 CRMLS
Property tax history
+7.5%/yrLatest (2025): $522 · +7.5% YoY. Source: county tax records.
Cash-flow waterfall
monthlySold comps — $/sqft
last 12 mo · ≤1 miLoading sold comps…