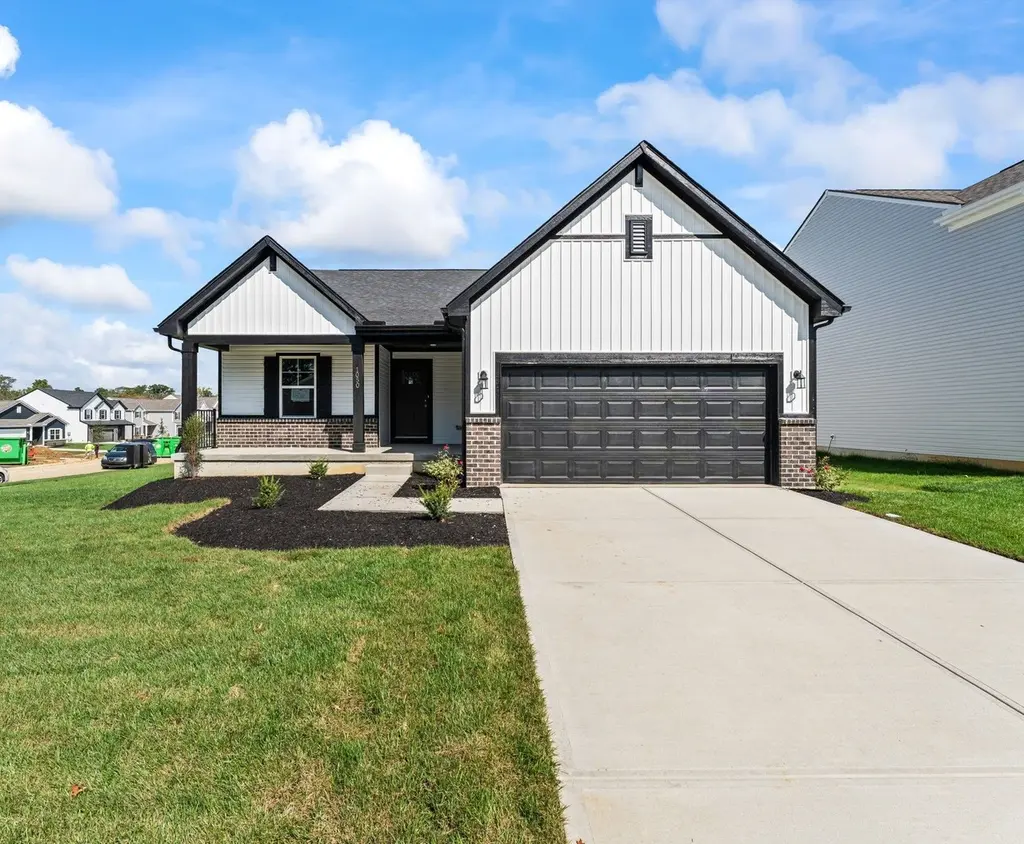
Bradford Plan
South Lebanon, OH 45039
$351,990C-
3 bd · 2.0 ba ·
1,613 sqft ·
Built —
· SingleFamily
· Active
· 261 DOM
Cashflow @ list (25.0% down · 7.5%)
Estimated rent
$2,867/mo
Mortgage (P&I)
−$1,920
Tax + insurance
−$610
HOA
−$0
Vac / Maint / Mgmt
−$602
Net cashflow
$-265/mo
Annual
$-3,184/yr
Cap rate
5.42%
Cash-on-cash
-3.11%
DSCR
0.86
1% rule
0.78%
Cash to close
$102,531
Investor read
- This is a 3-bed/2.0-bath single-family listed at $352k. Condition is rated good.
- At list price, monthly cash flow is $-265 ($-3k/yr) — negative.
- To cash-flow at today's rent, offer at most $328k (6.9% below list).
- To meet the 1% rule (rent ≥ 1% of price), the offer needs to be $287k (18.5% below list).
- It's been on market 261 days — a 12% lower offer ($310k) is reasonable based on typical stale-listing flexibility.
- Recommended offer: $287k (18.5% below list) — sets the bar for 1% rule.
- In year one you build about $39k of equity ($3k loan paydown + $37k appreciation (10.0% local appreciation)).
- Location reads 74/100 on livability (#279 in OH, #4,589 nationally) — a middle-class / working-renter tenant base. Strengths: crime A+, employment A+, cost of living A+; Watch: schools F, amenities F, commute F.
- Little Miami Local (rural): math 67% / reading 70% proficiency, ranked #140 of 656 in OH (top 21%) — acceptable for families but not a draw, mixed tenant base, ~2y average lease; only 17% free/reduced lunch — higher-income household profile.
- Market conditions: Rents rising fast (+7.4%/yr); 126 active listings in the ZIP; 1 comparable units currently listed for rent nearby; solid renter incomes; 1,224 units permitted in Warren County in 2024 (474 in 5+ unit buildings).
- Warren County population projected at +16% by 2050 — long-run rental-demand tailwind backs the buy-and-hold thesis.
- By year 2, paydown + projected appreciation supports a ~$63k cash-out refi (75% LTV) — recoverable capital for the next deal without selling this one.
- Cap rate 5.4% vs local median 3.5% in South Lebanon — top-decile yield for the area; either an underpriced asset or a hidden risk that comps aren't pricing in. Stress-test before assuming the spread holds.
- This rent runs 32% of the median local income ($109k/yr) — at the standard rent-burdened threshold; future hikes will face affordability resistance.
Questions for listing agent
- What do current leases actually rent for vs. the listed asking? Can we see a recent rent roll and the last 12 months of T-12 income?
- It's been on market 261 days. Have you received any prior offers? Is the seller open to a 19% concession, seller financing, or rate buy-down credit?
- Why hasn't it sold? Are there any deal-killer items the seller is aware of (foundation, flood, title, zoning, code violations)?
- Is there a deadline driving the sale (1031 exchange, divorce, estate, relocation)? That informs how much negotiation room exists.
- Schools are F-rated, which usually means shorter tenancies and higher turnover. Who's the typical renter profile here, and what's been the actual vacancy rate?
- What's the average days-on-market for RENTAL listings here right now (not sales)? A rising rental-DOM trend means longer vacancies and softer asking-rent achievability than the comps imply.
- What's the recent tenant-quality profile in this submarket — average credit score on applications, eviction rate, late-payment / NSF rate, and stable-employment percentage? A property-management company in the area should have these aggregated.
- How much new for-sale + rental construction is in the pipeline within 1–3 miles? Heavy new supply typically softens prices + rents 12–24 months out; constrained supply supports both.
CashFlowRE · CFR-NP4R81BPTYXRT0
· Data 2 days ago
cashflowre.app · 2026-05-29