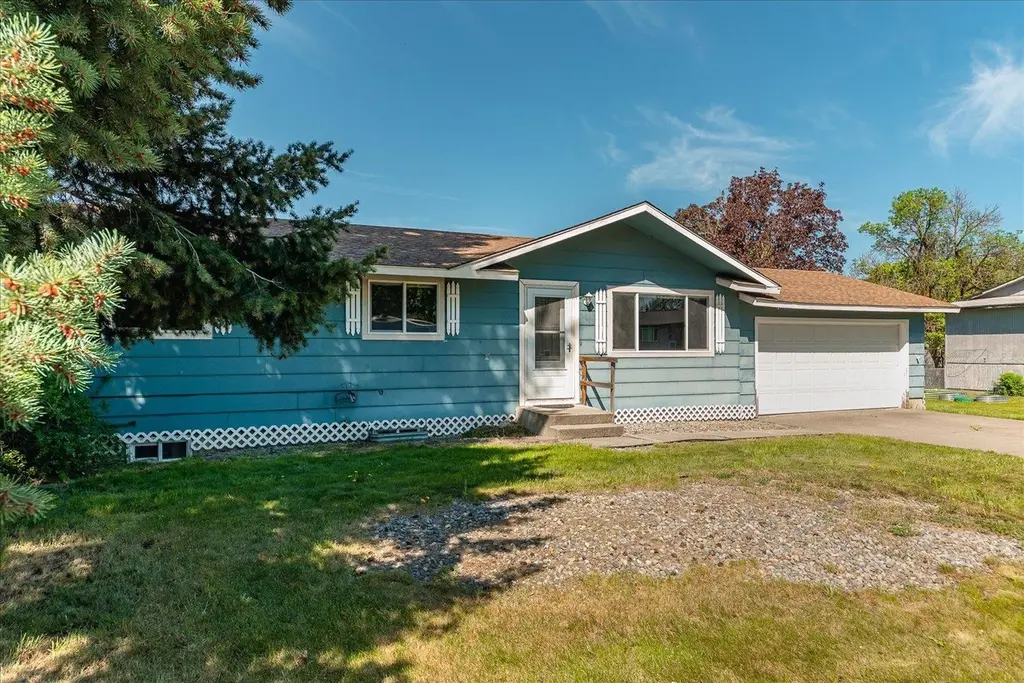
4605 N Darin Rd
Otis Orchards-East Farms, WA 99027
$359,950D
4 bd · 2.0 ba ·
1,760 sqft ·
Built 1972
· SingleFamily
· Pending
· 22 DOM
Cashflow @ list (25.0% down · 7.5%)
Estimated rent
$2,795/mo
Mortgage (P&I)
−$1,888
Tax + insurance
−$429
HOA
−$0
Vac / Maint / Mgmt
−$587
Net cashflow
$-108/mo
Annual
$-1,299/yr
Cap rate
5.93%
Cash-on-cash
-1.29%
DSCR
0.94
1% rule
0.78%
Cash to close
$100,786
Investor read
- This is a 4-bed/2.0-bath single-family listed at $360k.
- At list price, monthly cash flow is $-108 ($-1k/yr) — negative.
- To cash-flow at today's rent, offer at most $341k (5.3% below list).
- To meet the 1% rule (rent ≥ 1% of price), the offer needs to be $280k (22.4% below list).
- It's been on market 22 days — a 2% lower offer ($355k) is reasonable based on typical stale-listing flexibility.
- Recommended offer: $280k (22.4% below list) — sets the bar for 1% rule.
- Local home prices are declining (-3.0%/yr); year-one equity from $2k of loan paydown is wiped out by about $11k of value loss. Plan a longer hold.
- Location reads: area grade D — affects rentability + tenant quality, not the cash-flow math above.
- East Valley School District (Spokane) (urban): math 40% / reading 56% proficiency, ranked #160 of 291 in WA (top 55%) — families likely to look elsewhere, expect single-tenant / working-renter base with shorter leases.
- Zoned schools: Otis Orchards School (367 students, 76% FRL); East Valley Middle School (435 students, 71% FRL); East Valley High School (957 students, 58% FRL) — zoned schools average 68% FRL vs 45% district-wide (24 pts higher); higher-poverty schools than district average — tighter screening recommended.
- Market conditions: 58 active listings in the ZIP; 1 comparable units currently listed for rent nearby; 3,608 units permitted in Spokane County in 2024 (1,792 in 5+ unit buildings).
- Spokane County population projected at +13% by 2050 — modest demand growth; plan on rents tracking national, not racing it.
- 4 sale attempts since 24y ago with the ask held roughly flat each time — persistent listings suggest the price (not the market) is what's stuck; bring a comps-based counter.
- Current owner paid $171k; list at $360k implies a 111% gain — meaningful room to come down on a strong offer.
- Climate carrying-cost: major wildfire risk — expect insurance premiums to compound above CPI over the hold.
- Cap rate 5.9% vs local median 1.7% in Otis Orchards-East Farms — top-decile yield for the area; either an underpriced asset or a hidden risk that comps aren't pricing in. Stress-test before assuming the spread holds.
Questions for listing agent
- What do current leases actually rent for vs. the listed asking? Can we see a recent rent roll and the last 12 months of T-12 income?
- Built in 1972 — when were the roof, HVAC, electrical panel, plumbing, and water heater last replaced?
- Is there a deadline driving the sale (1031 exchange, divorce, estate, relocation)? That informs how much negotiation room exists.
- The area grade is low — what's the realistic commute time and amenity access for the typical tenant pool here? Any planned neighborhood developments (good or bad) we should know about?
- What's the average days-on-market for RENTAL listings here right now (not sales)? A rising rental-DOM trend means longer vacancies and softer asking-rent achievability than the comps imply.
- What's the recent tenant-quality profile in this submarket — average credit score on applications, eviction rate, late-payment / NSF rate, and stable-employment percentage? A property-management company in the area should have these aggregated.
- How much new for-sale + rental construction is in the pipeline within 1–3 miles? Heavy new supply typically softens prices + rents 12–24 months out; constrained supply supports both.
CashFlowRE · CFR-NPCVQ05RXQHDJK
· Data 3 weeks ago
cashflowre.app · 2026-05-29