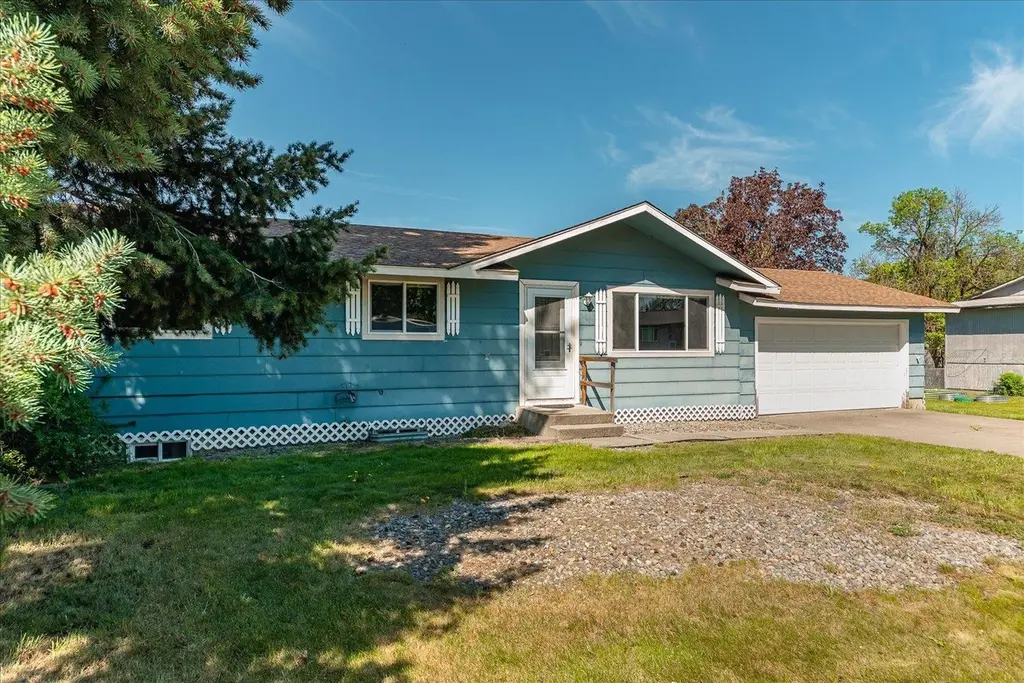
4605 N Darin Rd · Otis Orchards-East Farms, WA
Flood risk 1/10 · Minimal
- FEMA flood zone
- X (unshaded)
- Chance of flooding over 30 yrs
- 0.0%
- Est. flood insurance / yr
- $473 – $860
Fire risk 7/10 · Major
- Est. fire insurance / yr
- $604 – $1,122
Heat risk 3/10 · Minor
- Hot days now (above 93°F)
- 7 days/yr
- Hot days in 30 yrs
- 15 days/yr
Wind risk 1/10 · Minimal
- Chance of severe wind over 30 yrs
- —
Air-quality risk 9/10 · Severe
- Unhealthy air days now
- 15 days/yr
- Unhealthy air days in 30 yrs
- 17 days/yr
Risk factors via First Street. Map © Google.
Why this score? — see what drove the D grade
The composite is a weighted blend of 9 inputs, each scored 0–100. Each bar is that input's sub-score; the figure is the points it added to the 100-point composite (weight × sub-score).
- ARV discount +13.9/15.0
- Cash flow +11.7/30.0
- Schools +4.3/10.0
- DSCR +3.4/10.0
- 1% rule +2.8/10.0
- Rent growth +2.5/5.0
- Livability +2.5/5.0
- Condition / age +2.5/5.0
- Appreciation +0.0/10.0
$359,950
🖨 Deal sheet (PDF) 📄 Offer letter ✓ Due diligence
Listing remarks MLS
Motivated Seller. 3 bed 1 3/4 bath, oversized fenced backyard. Newer roof, end of street. 1 year home warranty included.
Key facts
- Rv parking
- Quiet setting
- Finished basement
Tags
Property features AI
Exterior
- Parking: Attached garage with garage door opener; RV access/parking; 2 garage spaces
- Home design: Single-family residence; One-story structure; Below-grade finished area present
- Construction: Masonite exterior; Composition roof; Full basement (finished)
- Exterior features: Fenced yard; Located on a cul-de-sac; Oversized lot; Paved road frontage
Interior
- Kitchen: Range; Refrigerator
- Bedrooms: 4 bedrooms
- Heating & cooling: Natural gas forced-air heating
- Interior features: Pantry; Finished full basement with recreation/family area
- Laundry & utility: Basement laundry area
Neighborhood map
What this means for you Summary
Snapshot
- This is a 4-bed/2.0-bath single-family listed at $360k.
Deal economics
- At list price, monthly cash flow is $-108 ($-1k/yr) — negative.
- To cash-flow at today's rent, offer at most $341k (5.3% below list).
- To meet the 1% rule (rent ≥ 1% of price), the offer needs to be $280k (22.4% below list).
- Recommended offer: $280k (22.4% below list) — sets the bar for 1% rule.
- Cap rate 5.9% vs local median 1.7% in Otis Orchards-East Farms — top-decile yield for the area; either an underpriced asset or a hidden risk that comps aren't pricing in. Stress-test before assuming the spread holds.
Location & tenants
- Location reads: area grade D — affects rentability + tenant quality, not the cash-flow math above.
- East Valley School District (Spokane) (urban): math 40% / reading 56% proficiency, ranked #160 of 291 in WA (top 55%) — families likely to look elsewhere, expect single-tenant / working-renter base with shorter leases.
- Zoned schools: Otis Orchards School (367 students, 76% FRL); East Valley Middle School (435 students, 71% FRL); East Valley High School (957 students, 58% FRL) — zoned schools average 68% FRL vs 45% district-wide (24 pts higher); higher-poverty schools than district average — tighter screening recommended.
- Market conditions: 58 active listings in the ZIP; 1 comparable units currently listed for rent nearby; 3,608 units permitted in Spokane County in 2024 (1,792 in 5+ unit buildings).
Forward outlook
- Local home prices are declining (-3.0%/yr); year-one equity from $2k of loan paydown is wiped out by about $11k of value loss. Plan a longer hold.
- Spokane County population projected at +13% by 2050 — modest demand growth; plan on rents tracking national, not racing it.
Negotiation context
- It's been on market 22 days — a 2% lower offer ($355k) is reasonable based on typical stale-listing flexibility.
- 4 sale attempts since 24y ago with the ask held roughly flat each time — persistent listings suggest the price (not the market) is what's stuck; bring a comps-based counter.
- Current owner paid $171k; list at $360k implies a 111% gain — meaningful room to come down on a strong offer.
Risks & watch-outs
- Climate carrying-cost: major wildfire risk — expect insurance premiums to compound above CPI over the hold.
Questions for the listing agent
- What do current leases actually rent for vs. the listed asking? Can we see a recent rent roll and the last 12 months of T-12 income?
- Built in 1972 — when were the roof, HVAC, electrical panel, plumbing, and water heater last replaced?
- Is there a deadline driving the sale (1031 exchange, divorce, estate, relocation)? That informs how much negotiation room exists.
- The area grade is low — what's the realistic commute time and amenity access for the typical tenant pool here? Any planned neighborhood developments (good or bad) we should know about?
- What's the average days-on-market for RENTAL listings here right now (not sales)? A rising rental-DOM trend means longer vacancies and softer asking-rent achievability than the comps imply.
- What's the recent tenant-quality profile in this submarket — average credit score on applications, eviction rate, late-payment / NSF rate, and stable-employment percentage? A property-management company in the area should have these aggregated.
- How much new for-sale + rental construction is in the pipeline within 1–3 miles? Heavy new supply typically softens prices + rents 12–24 months out; constrained supply supports both.
Investment metrics
- 1% rule
- 0.78% ✗
- Cap rate
- 5.93%
- Cash-on-cash
- -1.29%
- DSCR
- 0.94
- GRM
- 10.7
CMA / ARV
- ARV (median comp)
- $419,742
- List price
- $359,950
- Delta
- -14.24%
- Verdict
- UNDERPRICED
- Comps
- 20 within 1.0 mi
Show comp detail 10 sales within ~0.75 mi
| Address | Dist | Beds/Ba | Sqft | Sold | Price | $/sf | Match |
|---|---|---|---|---|---|---|---|
| 5007 N Darin Rd | 0.25mi | 4/2.0 | 1,932 (+10%) | 0mo | $415,000 | $215 | 72 |
| 5105 N Tiara Ct | 0.30mi | 4/2.0 | 1,727 (-2%) | 19mo | $389,900 | $226 | 67 |
| 5014 N Karen Rd | 0.27mi | 5/2.0 (+1) | 1,597 (-9%) | 2mo | $370,000 | $232 | 65 |
| 21316 E Queen Ave | 0.45mi | 4/2.0 | 1,728 (-2%) | 14mo | $440,000 | $255 | 64 |
| 20716 E Gilbert Rd | 0.41mi | 3/1.0 (-1) | 1,695 (-4%) | 11mo | $379,000 | $224 | 57 |
| 21304 E Queen Ave | 0.43mi | 3/2.0 (-1) | 1,728 (-2%) | 18mo | $460,000 | $266 | 57 |
| 21023 E Trent Ave | 0.57mi | 5/2.0 (+1) | 1,758 (-0%) | 15mo | $424,000 | $241 | 56 |
| 4908 N Darin Rd | 0.17mi | 3/2.0 (-1) | 1,564 (-11%) | 22mo | $423,000 | $270 | 50 |
| 3601 N Ashton Rd | 0.64mi | 3/3.0 (-1) | 1,770 (+1%) | 14mo | $603,700 | $341 | 49 |
| 5018 N Karen Rd | 0.28mi | 5/2.0 (+1) | 1,980 (+12%) | 16mo | $428,000 | $216 | 48 |
Match score weights: distance 35% · size 25% · config 20% · recency 20%. Top-matched comps best support the ARV.
Projected returns pro-forma
-3.0% appreciation · 3.0% rent growth · sell at horizon
- IRR
- -18.4%
- Equity multiple
- 0.35×
- Total profit
- $-65,284
- Equity at exit
- $53,670
- IRR
- -10.8%
- Equity multiple
- 0.35×
- Total profit
- $-65,981
- Equity at exit
- $31,122
Cash invested: $100,786 (down + closing). Projections, not guarantees.
Landlord ↔ Tenant lean methodology
- Overall (STATE)
- 28 Tenant-Leaning
- State Washington
- 28 Tenant-Leaning · D+8
- County
- — inherits STATE
- City
- — inherits STATE
ZIP-level market 99027
- Home prices YoY
- -20.5%
- Active inventory
- 58
- Price-to-rent
- 10.7×
Monthly cashflow live
- Estimated rent
- $2,795 medium interval (Pro) →
- Mortgage (P&I)
- −$1,888
- Tax from tax record
- −$279 /mo · $3,344/yr
- Insurance
- −$150
- HOA
- −$0
- Vacancy / Maint / Mgmt
- −$587
- Net cashflow
- $-108
Break-even live
Sensitivity live
| Price | -10% $96 | -5% $-6 | +0% $-108 | +5% $-210 | +10% $-312 |
|---|---|---|---|---|---|
| Rent | -10% $-329 | -5% $-219 | +0% $-108 | +5% $2 | +10% $113 |
| Rate | -1.0pp $73 | -0.5pp $-17 | base $-108 | +0.5pp $-202 | +1.0pp $-296 |
UW: 25.0% down · 7.5% · 30yr · 1.5% tax · 5.0% vac · 8.0% maint · 8.0% mgmt
Financing live
Cash to close
- Down payment
- $89,988
- Closing costs
- $10,798
- Reserves months
- —
- Total cash needed
- —
Loan-product check · same deal, 3 products live
Conventional
25% down · 7.5% · 30yr
- Down + closing
- —
- Monthly P&I
- —
- Monthly cashflow
- —
- DSCR
- —
- Eligible?
- —
Personal DTI + credit; lowest rate.
DSCR
20% down · 8.5% · 30yr
- Down + closing
- —
- Monthly P&I
- —
- Monthly cashflow
- —
- DSCR
- —
- Eligible?
- —
No personal income docs; deal must DSCR.
Hard money
10% down · 12.0% · 12mo
- Down + closing
- —
- Monthly P&I
- —
- Monthly cashflow
- —
- DSCR
- —
- Eligible?
- —
Short-term bridge; refi at stabilization.
Rent comps 1 comps
| Address | Beds | Baths | Sqft | Rent | $/sqft | DOM | Units | Dist |
|---|---|---|---|---|---|---|---|---|
| 3113 N Rio Grande Rd Otis Orchards, WA | 3.0 | 2.5 | 2350 | $2,795 | $1.19 | 45d | 1 | 1.39mi |
Listing history 12 events
-
2026-05-31status $359,950 Pending 22 DOM
-
2026-05-07$359,950 Active 880-char remark
-
2007-02-09soldstatus $170,671 121-char remark
Show marketing remark (121 chars)
Motivated Seller. 3 bed 1 3/4 bath, oversized fenced backyard. Newer roof, end of street. 1 year home warranty included.
-
2007-02-07$169,700 121-char remark
Show marketing remark (121 chars)
Motivated Seller. 3 bed 1 3/4 bath, oversized fenced backyard. Newer roof, end of street. 1 year home warranty included.
-
2007-02-07soldstatus $170,670
Show marketing remark (121 chars)
Motivated Seller. 3 bed 1 3/4 bath, oversized fenced backyard. Newer roof, end of street. 1 year home warranty included.
-
2007-01-14historical
-
2006-08-08$169,700
-
2002-03-18soldstatus $102,900
-
2002-03-13soldstatus $102,900
-
2002-01-23$99,900
-
1995-11-13soldstatus $91,000
-
1990-11-05soldstatus $52,500
ⓘ Source: listings_history table (triggers on properties + properties_extension) + one-shot
backfill from property_details.listing_events for pre-trigger history.
Tax reassessment forecast WA · Resets to sale price
- Current annual tax
- $3,344 · $279/mo
- Projected year-2 tax
- $3,528 · $294/mo
- Expected delta
- +$183/yr (+$15/mo · 5.5%)
ⓘ Screening estimate from a state-policy table — verify with the county assessor before closing.
Climate risk First Street
- Flood 1/10 Low FEMA zone X (unshaded) · 0% chance over 30 yrs
- Wildfire 7/10 Severe
- Heat 3/10 Moderate 7 d/yr ≥93°F today · 15 d/yr by 30 yrs out
- Wind 1/10 Low
- Air quality 9/10 Extreme 15 unhealthy d/yr today · 17 by 30 yrs out
Nearby sold comps map
Loading sold comps map…
Walkable amenities ~0.75 mi
Loading nearby amenities…
Taxation est. · year 1
- Rental income
- $33,540
- − Mortgage interest
- −$20,163
- − Property taxes
- −$3,344
- − Insurance
- −$1,800
- − Repairs & maintenance
- −$2,683
- − Management
- −$2,683
- − Depreciation
- −$10,471
- Taxable loss
- −$7,604
- Est. tax savings @ 24.0%
- +$1,825
- After-tax cash flow
- $526/yr
For passive investors: Depreciation is non-cash, so a rental often shows a tax loss while cash-flowing — sheltering income. Rental losses are passive: they offset passive income freely, and up to $25,000/yr can offset ordinary (W-2) income if you actively participate and your MAGI is under $100k (phasing out to $0 by $150k); unused losses carry forward. On sale, claimed depreciation is recaptured at up to 25%, and gains may owe capital-gains tax (a 1031 exchange can defer both). Figures are a year-1 estimate at your 24.0% rate — not tax advice; consult a CPA.
Schools (NCES district)
- District
- East Valley School District (Spokane)
- NCES district ID
- 5302280
- Math proficiency
- 40% ▼ -5.00%
- Reading proficiency
- 56% ▼ -4.00%
- Median HH income
- $49,557
- Composite
- 43.15/100
- National rank
- #6603
- State rank
- #160 of 291 in WA
Livability — Otis Orchards-East Farms
No livability data for this city. (Only ~50 U.S. cities are tracked.)
Census & demographics
- Census place
- Otis Orchards-East Farms, WA
- Population (ZIP)
- 5,878
Population outlook (Spokane County) Hauer SSP2
- Today (2025)
- 531,314 people
- By 2030
- 549,278 · +3.4%
- By 2040
- 577,822 · +8.8%
- By 2050
- 598,188 · +12.6%
- By 2075
- 630,744 · +18.7%
- By 2100
- 622,360 · +17.1%
Race, ethnicity, and origin ACS 2023
- Neighborhood character
- Predominantly White (93%)
- Race & ethnicity
- White 93% Two or more races 3% Hispanic / Latino 3%
- Common ancestry
- Slovak 6% Portuguese 3% Lithuanian 2%
- Foreign-born
- 2%
Political lean MEDSL · Spokane
- 2024 margin
- Toss-up / Even · D 46.0% · R 51.0% · Other 3.0%
- 2008→2024 swing
- -3.8pp toward R · 2008: -1.1pp · 2024: -5.0pp
- All cycles
- 2024: R+5.0 2020: R+4.3 2016: R+8.3 2012: R+6.3 2008: R+1.1
Not yet ingested
- Civics
- —
Market trends
- HPI YoY
- ▼ -92.71%
- Current HPI
- 360.3438
- Rent YoY
- —
- Metro
- —
- State GDP YoY
- ▲ 4.65%
- F500 in state
- 22
Industry mix (Fortune 500 HQ in WA)
| Industry | F500 HQs | Revenue |
|---|---|---|
| Retail | 2 | $269B |
|
||
| Technology / Retail | 1 | $638B |
|
||
| Technology | 1 | $245B |
|
||
| Telecommunications | 1 | $38B |
|
||
| Food / Beverage | 1 | $36B |
|
||
| Automotive / Trucks | 1 | $34B |
|
||
Price history
+585.6% since first listed12 events — show timeline
- 2026-05-30 Pending — SPOKANEMLS as Distributed by MLS Grid
- 2026-05-07 Listed $359,950 SPOKANEMLS as Distributed by MLS Grid
- 2007-02-09 Sold (MLS) $170,671 SPOKANEMLS as Distributed by MLS Grid
- 2007-02-07 Sold (Public Records) $170,670 Public Records
- 2007-02-07 Listed $169,700 SPOKANEMLS as Distributed by MLS Grid
- 2007-01-14 Listing Removed — SPOKANEMLS as Distributed by MLS Grid
- 2006-08-08 Listed $169,700 SPOKANEMLS as Distributed by MLS Grid
- 2002-03-18 Sold (MLS) $102,900 SPOKANEMLS as Distributed by MLS Grid
- 2002-03-13 Sold (Public Records) $102,900 Public Records
- 2002-01-23 Listed $99,900 SPOKANEMLS as Distributed by MLS Grid
- 1995-11-13 Sold (Public Records) $91,000 Public Records
- 1990-11-05 Sold (Public Records) $52,500 Public Records
Property tax history
+4.3%/yrLatest (2026): $3,344 · +1.6% YoY. Source: county tax records.
Cash-flow waterfall
monthlySold comps — $/sqft
last 12 mo · ≤1 miLoading sold comps…