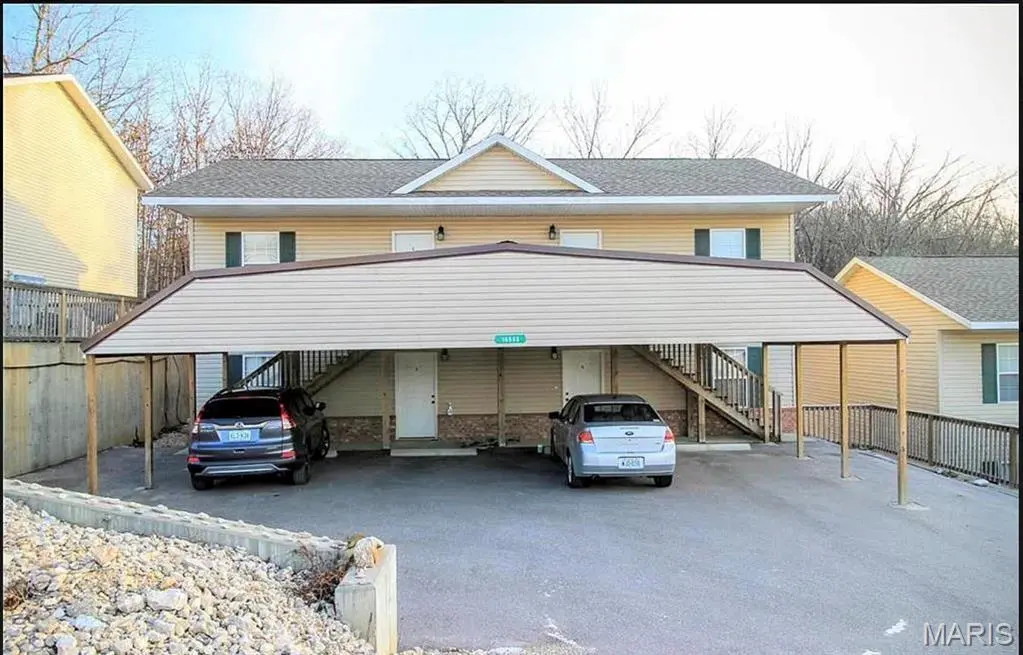
16565 Hunters Ridge Ln
St. Robert, MO 65584
$289,900C+
None bd · None ba ·
— sqft ·
Built 2011
· MultiFamily
· Pending
· 14 DOM
Cashflow @ list (25.0% down · 7.5%)
Estimated rent
$3,032/mo
Mortgage (P&I)
−$1,520
Tax + insurance
−$259
HOA
−$0
Vac / Maint / Mgmt
−$637
Net cashflow
$616/mo
Annual
$7,393/yr
Cap rate
8.84%
Cash-on-cash
9.11%
DSCR
1.41
1% rule
1.05%
Cash to close
$81,172
Investor read
- This is a 4 × 1-bed/1-bath units multifamily listed at $290k.
- At list price, monthly cash flow is $616 ($7k/yr) — positive. Per door: $154/mo.
- The deal already cash-flows at list — no discount required.
- Meets the 1% rule at list price ($3k rent vs $290k).
- Only 14 days on market — expect competitive offers; lowballing is unlikely to land.
- Local home prices are declining (-3.0%/yr); year-one equity from $2k of loan paydown is wiped out by about $9k of value loss. Plan a longer hold.
- Location reads: area grade C — affects rentability + tenant quality, not the cash-flow math above.
- Waynesville R-VI (town): math 46% / reading 53% proficiency, ranked #41 of 324 in MO (top 13%) — families likely to look elsewhere, expect single-tenant / working-renter base with shorter leases.
- Zoned schools: Freedom Elem. (math 44% / reading 45%, grade F, #413 of 1,115 statewide, top 42%, 961 students, 54% FRL); Waynesville Sr. High (math 37% / reading 53%, grade D-, #176 of 521 statewide, top 34%, 1,704 students, 39% FRL) — zoned schools average 46% FRL vs 28% district-wide (18 pts higher); higher-poverty schools than district average — tighter screening recommended.
- Market conditions: Rents rising fast (+10.2%/yr); 130 active listings in the ZIP; 7 comparable units currently listed for rent nearby; rentals lingering (median 44d on market — plan ~5-8 weeks vacancy on turnover, expect pricing pressure); 100% of comp listings sitting > 30 days — soft ceiling on asking rent; 62 units permitted in Pulaski County in 2024 (0 in 5+ unit buildings).
- 4 sale attempts since 7y ago with the ask held roughly flat each time — persistent listings suggest the price (not the market) is what's stuck; bring a comps-based counter.
- Current owner paid $235k; 23% above their basis — modest negotiation headroom, anchor on the comps not their cost.
- At projected returns (-3.0% appreciation + 8.0% rent growth), your $81k cash investment doubles in ~8 years — after that, you're playing with house money.
- Cap rate 8.8% vs local median 4.4% in St. Robert — top-decile yield for the area; either an underpriced asset or a hidden risk that comps aren't pricing in. Stress-test before assuming the spread holds.
- At $3,032/mo this rent would consume 57% of the median local household income ($63k/yr) (locally 368% of renters already pay >50% of income on rent) — very limited rent-growth headroom before tenants either downsize or default.
Questions for listing agent
- Can we see the unit-by-unit rent roll, current vacancy, and any below-market leases? What's the average tenancy length?
- What capital expenditures (roof, boiler, parking lot, exteriors) have been made in the last 5 years, and what's planned in the next 2?
- Is there a deadline driving the sale (1031 exchange, divorce, estate, relocation)? That informs how much negotiation room exists.
- What's the average days-on-market for RENTAL listings here right now (not sales)? A rising rental-DOM trend means longer vacancies and softer asking-rent achievability than the comps imply.
- What's the recent tenant-quality profile in this submarket — average credit score on applications, eviction rate, late-payment / NSF rate, and stable-employment percentage? A property-management company in the area should have these aggregated.
- How much new apartment / multifamily construction is in the pipeline within 1–3 miles? Heavy new supply (>2% of stock underway) typically softens rents 12–24 months out; light construction supports rent growth.
CashFlowRE · CFR-NQDMJ926C65AP0
· Data 4 days ago
cashflowre.app · 2026-05-29